Figures & data
Table 1. Hen Harrier broods provided with diversionary food 2008–15. Male status: 1 = monogamous, 2 = polygamous (* with tertiary female); female status: 1 = monogamous, 2 = primary female of a polygamous male, 3 = secondary female of a polygamous male. # excluded from analysis.
Figure 1. Mean (±se) proportion of prey items identified during hide watches (n = 7 nests), nest cameras (n = 8 nests) or in regurgitated pellets (n = 10 nests). The total amount of diversionary food (df) includes both poultry chicks and rats.
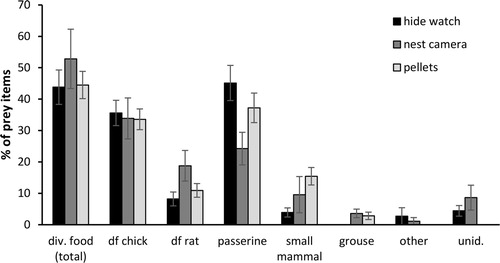
Figure 2. Annual variation in prey abundance (2008–15): (a) May Red Grouse chick index (grouse chicks km−2, n = 10 count areas), (b) Vole index (voles caught per 100 trap nights, n = 10 trap lines) and passerine index (mean number of Meadow Pipits and Sky Larks encountered per km, n = 20 1 × 1-km squares)
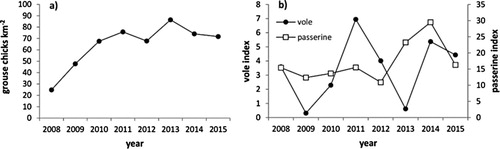
Figure 3. Seasonal change in grouse chick delivery rates as observed by nest cameras (n = 8 broods). Data points represent mean delivery rates per Hen Harrier brood and week of year. As hatch dates varied, not every brood contributed data to each week.
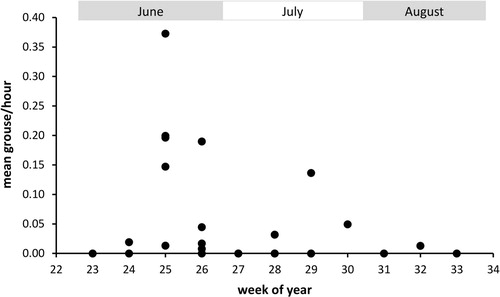
Table 2. Grouse chicks taken by Hen Harriers when given diversionary food (‘fed’) by method of diet assessment (total number and % of those available in May). All values are means, with 95% confidence intervals given in brackets. As the calculation of grouse chicks taken by Hen Harriers was based on predicted delivery rates across the whole 60-day period (see methods), years with only one nest also have an associated CI.
Table 3. Numbers of Red Grouse chicks expected to be taken by Hen Harriers under unfed conditions following Redpath & Thirgood (Citation1999) and Amar et al. (Citation2004), and reductions in grouse chick numbers taken by fed Hen Harriers in comparison to unfed conditions, by method of diet assessment (excluding hide watches as all delivery rates were zero). All values are means, with 95% confidence intervals given in brackets.
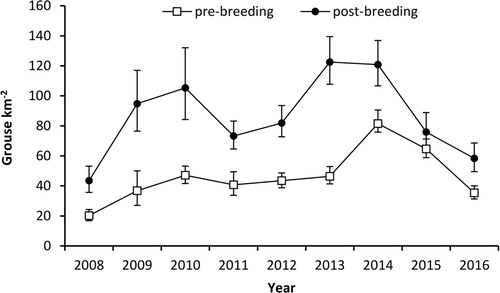
Figure 4. Annual variation in pre- and post-breeding Red Grouse densities (birds km−2) 2008–16 derived from distance sampling. Error bars represent 95% confidence intervals.