Figures & data
Figure 1. Illustration of the sampling design for two female ducks. Rows correspond to individual females, columns to individual visits from May to July. Cells with a duck symbol indicate visits with a positive record of the female, empty cells indicate visits in which the female was not recorded. Grey shading shows visits where the given female was known to be present due to her previous and subsequent records; only these cells were retained in all statistical analyses. Each cell counts as one observation, giving a total of 980 observations in the data set.
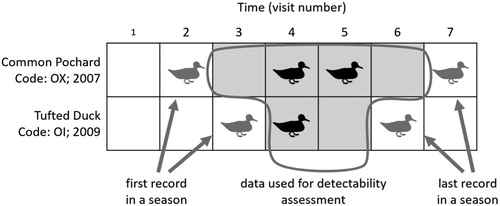
Table 1. Timing of breeding season of individual females of Red-crested Pochard, Common Pochard and Tufted Duck in South Bohemia (Czech Republic) in 2004–2016.
Figure 2. Relative importance of explanatory variables (sum of Akaike weights, based on all 127 candidate models).
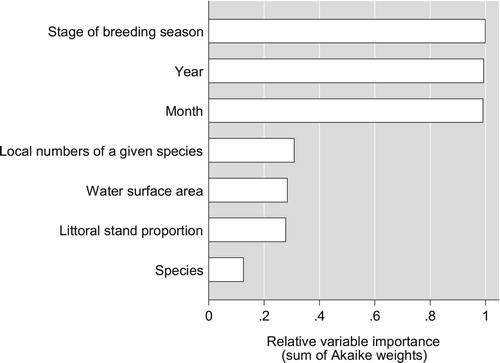
Table 2. Candidate models of detection probability retained after the elimination of models with uninformative parameters.
Table 3. Resighting probability (ratio of positive records to expected records when presence of the duck female was expected according to previous and subsequent possitive records) in various stages of the breeding season.
Table 4. Resighting probability (ratio of positive records to expected records when presence of the duck female was expected according to previous and subsequent possitive records) in individual census months.
Table 5. Summary of resighting probability (ratio of positive records to expected records when presence of duck female was expected according to previous and subsequent records) and census results. Results are presented as estimate ± se (sample size in parentheses).
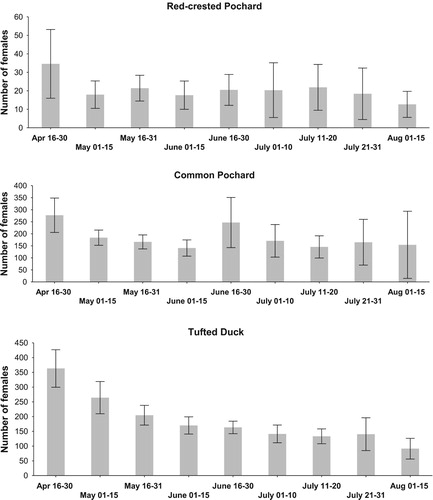
Figure 3. Seasonal variation in the numbers of female duck recorded in the study area (bars show means ± 0.95 confidence intervals).