
Figures & data
Table 1. Sampling details of reed warbler specimens collected from Italy for this study. The identifier of sampling sites in the map of , the cyt b haplotypes and the GenBank accession numbers of the sequenced samples are also reported (* haplotypes discovered in this study).
Figure 1. Median-joining network of cyt b haplotypes of Western Palearctic Acrocephalus scirpaceus/A. baeticatus species complex populations (, Table S1). Each circle represents a haplotype and circle size is proportional to haplotype frequency. Colours indicate different subspecies and blue dots also account for Italian sampling sites. Dashes represent substitutions. Distribution map is shown on the countries boundaries basis.
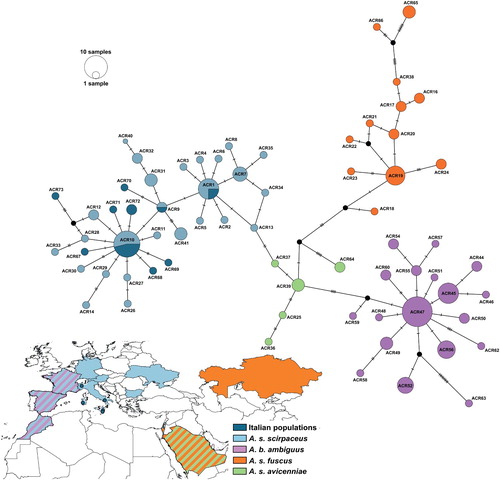
Table 2. Between groups genetic divergence values of cyt b sequences, based on the uncorrected p-distance calculation (bottom left), for the taxa of European and African Reed Warblers considered in this study. Standard error values are reported above the diagonal.