
Figures & data
Figure 1. Rates of permanent exclusions in England, Wales, and Scotland 2006/07 to 2020/211
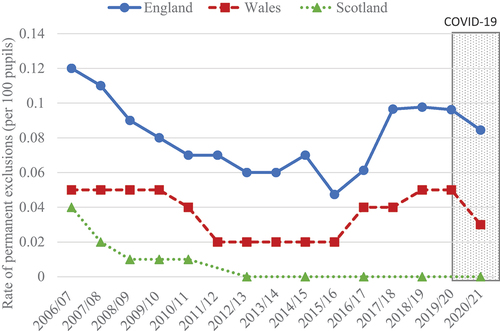
Figure 2. Rates of temporary exclusions in England, Wales, Scotland,1 and Northern Ireland,2 2006/07 to 2020/21
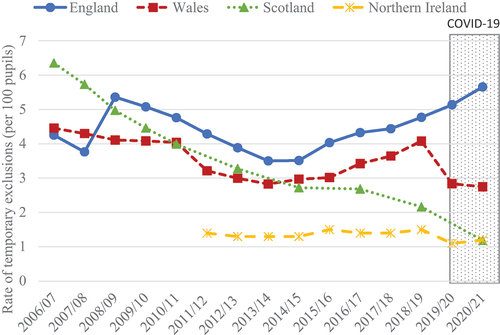
Figure 3. Average rate of school exclusions by local authority in Wales
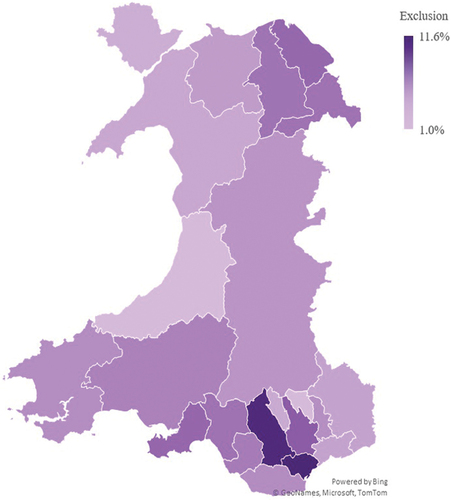
Figure 4. Number of excluded pupils in each academic year over time
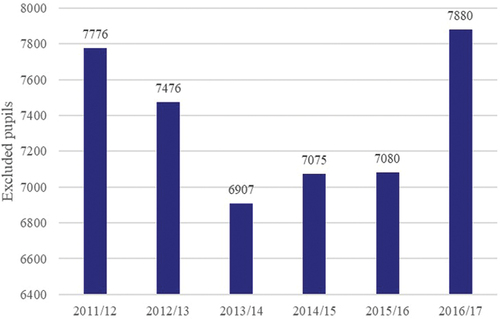
Figure 5. Percentage of pupils excluded each year
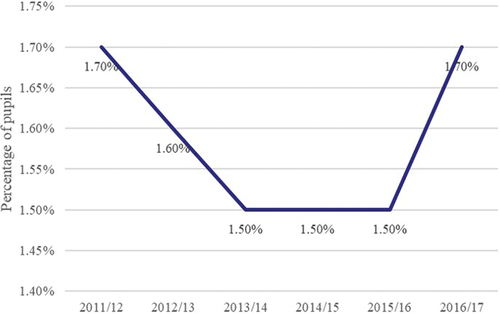
Figure 6. Total and average number of days lost due to exclusion in each academic year
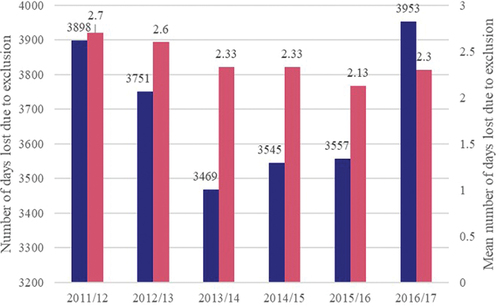
Figure 7. Total and average number of exclusion instances in each academic year
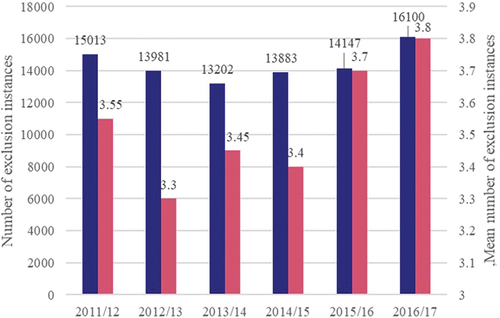
Figure 8. Average number of exclusion instances per cohort pupil by age
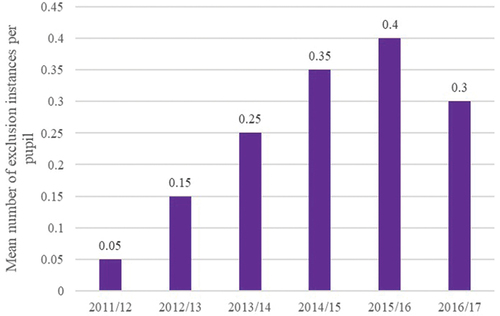
Table 1. Number (and percentages) of pupils ever excluded between year 6 and year 11 by characteristics
Table 2. Logistic regression models using ever excluded as outcome (odds ratios with 95%CI)
Table 3. Multivariate multinomial regression models for school exclusion trajectory groups (reference group for analysis pupils with no exclusion) (odds Ratios)1
7. Data Availability Statement
No new data was created during this study.