2,154
Views
0
CrossRef citations to date
0
Altmetric
Nutrition & Metabolism

Varying starch to fat ratios in pelleted diets: II. Effects on intestinal histomorphometry, Clostridium perfringens and short-chain fatty acids in Eimeria-challenged broiler chickens

, , , , &
Pages 92-100 | Received 07 Feb 2020, Accepted 05 May 2020, Published online: 28 Sep 2020

Figures & data

Table 1. Primers and probes used for qPCR analysis

Table 2. Effect of dietary starch to fat ratios on intestinal histomorphometry on days 16, 21–23 and 29.1.

Figure 1. Effect of dietary starch to fat ratios on caecal Clostridium perfringens counts (log10 cfu/g) during days 21–23. Boxplots with medians indicated by horizontal lines and means indicated by diamonds. Based on samples from 36 chickens per diet. HS: high starch to fat ratio diet; LS: low starch to fat ratio diet. cfu/g = colony forming units per gram

Figure 1. Effect of dietary starch to fat ratios on caecal Clostridium perfringens counts (log10 cfu/g) during days 21–23. Boxplots with medians indicated by horizontal lines and means indicated by diamonds. Based on samples from 36 chickens per diet. HS: high starch to fat ratio diet; LS: low starch to fat ratio diet. cfu/g = colony forming units per gram

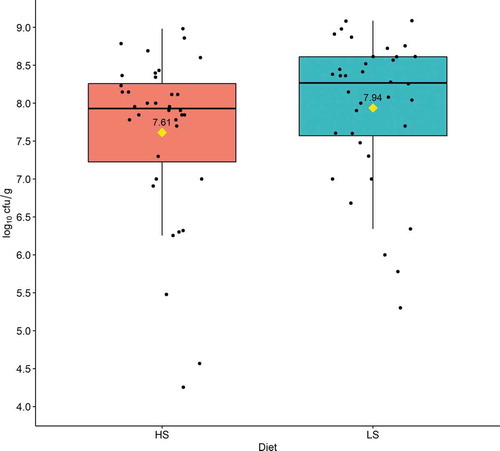
Table 3. The percentage of netB-positive and netB-negative caecal samples.1.

Figure 2. Effect of dietary starch to fat ratios on the Clostridium perfringens netB:cpa ratio in caecal samples on days 16, 21–23 and 29

Boxplots with medians indicated by horizontal lines and means indicated by diamonds. Based on samples from 12 chickens per diet per time point. Statistical analysis carried out by Mann-Whitney U test. HS: high starch:fat ratio diet; LS: low starch:fat ratio diet; ns = not significant.
Figure 2. Effect of dietary starch to fat ratios on the Clostridium perfringens netB:cpa ratio in caecal samples on days 16, 21–23 and 29

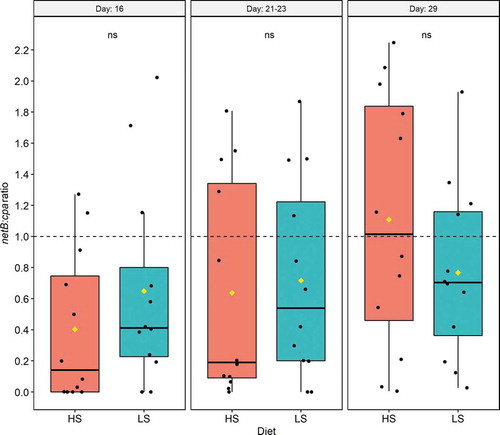
Table 4. Effect of dietary starch to fat ratios on short chain fatty acids (SCFAs; µmol/g) in caecum.1.