
Figures & data
Figure 1. The Flow chart illustrates steps in chicken production on farms. Red steps indicate points at which Campylobacter spp. can pose a risk. Green steps indicate points at which Campylobacter spp. can be controlled. Orange steps indicate the possibility of risk/control, which depends on behaviour/actions
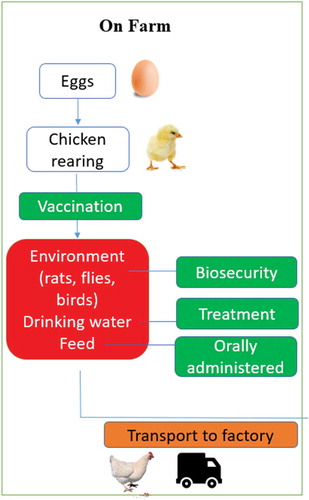
Table 1. Control measures to reduce Campylobacter prevalence and transmission in poultry flocks
Table 2. Feed additives orally administered to reduce Campylobacter prevalence and transmission in poultry flocks