
Figures & data
Table 1. Analysed chemical composition (g/kg) of the wheat, dehulled faba bean parent meal (FBPM), and the air-classified faba bean starch-rich fraction (FBS)
Figure 1. Particle-size distribution of the starch sources. Volume weighted mean: 50 µm for the FBS and 240 µm for the wheat. Surface weighted mean: 21 µm for the FBS and 26 µm for the wheat
Table 2. Experimental diet composition, analysed and calculated nutrient content
Table 3. Analysed amino acid1 composition (g/kg DM) of the diets
Table 4. Sequences of primers used for quantitative real-time PCR
Table 5. The effect of starch source and processing method on the growth performance1 of male broilers from 17 to 29 d
Table 6. The effect of starch source and processing method on starch digestibility along the intestinal tract of 30-d-old male broilers1.
Figure 2. a) Light microscopy images showing starch granules (black dots) in digesta from the upper and lower jejunum (Uj, Lj) and ileum (Ui, Li) collected from birds fed pelleted diets based on either wheat or faba bean starch (FBS). Each column represents one replicate pen with samples collected from one bird per pen. Magnification x 10. b) Light microscopy images showing starch granules (black dots) in digesta from the upper and lower jejunum (Uj, Lj) and ileum (Ui, Li) collected from birds fed extruded diets based on either wheat or faba bean starch (FBS). Each column represents one replicate pen with samples collected from one bird per pen. Magnification x 10
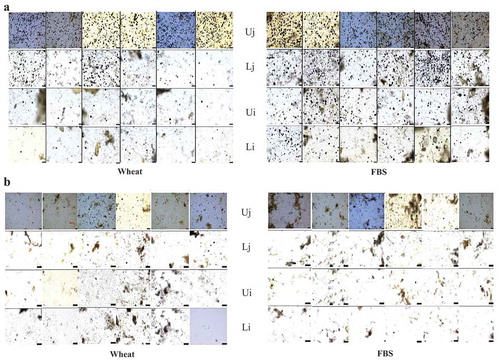
Table 7. The effect of starch source and processing method on the expression1 of glucose transporter 1 (GLUT1), glucose transporter 2 (GLUT2) and sodium glucose transporter 1 (SGLT1) in the upper jejunum of 30-d-old male broilers.2
Table 8. The effect of starch source and processing method on the apparent nitrogen digestibility along the intestinal tract of 30-d-old male broilers.1
Table 9. The effect of starch source and processing method on the ratios of starch and nitrogen disappearance rates (SNDR) along the intestinal tract of 30-d-old male broilers.1
Table 10. The effect of starch source and processing method on the activities of digestive enzymes (U/g chyme) in the digesta collected from the lower jejunum of 30-d-old male broilers.1