Figures & data
Table 1. Access to Safe Sanitation: District Weights for Synthetic Sumedang (overall population)
Table 2. Access to Safe Sanitation: Predictor Means (overall population)
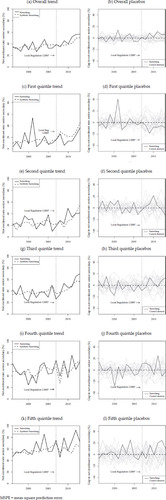
FIGURE 1 Trends in Household Access to Safe Sanitation: Sumedang vs Synthetic Sumedang and Placebo Gaps (excludes districts with pre-intervention MSPE five times higher than Sumedang’s)
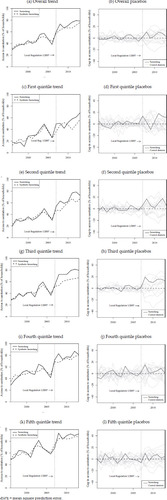
FIGURE 2 Household Access to Safe Sanitation for the Third Quintile: Ratio of Post-Implementation RMSPE to Pre-Implementation RMSPE and Leave-One-Out Distribution, Sumedang and Control Districts
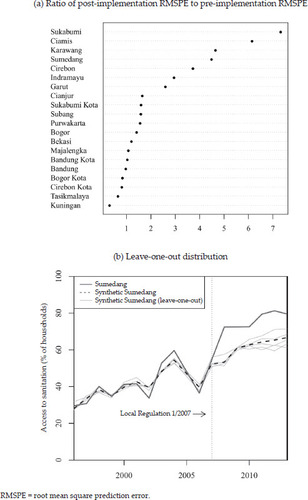
FIGURE 3 Trends in Household Access to Safe Water: Sumedang vs Synthetic Sumedang and Placebo Gaps (excludes districts with pre-intervention MSPE five times higher than Sumedang’s)
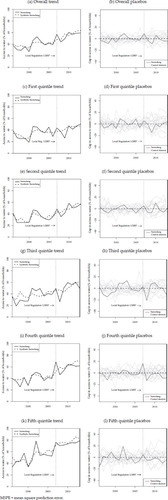
FIGURE 4 Trends in Net Junior Secondary School Enrolment Rate: Sumedang vs Synthetic Sumedang and Placebo Gaps (excludes districts with pre-intervention MSPE five times higher than Sumedang’s)
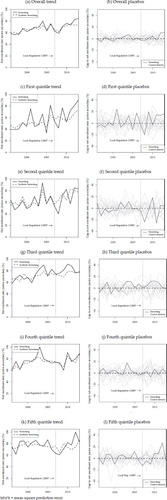
FIGURE 5 Net Junior Secondary School Enrolment Rate for the Whole Population: Ratio of Post-Implementation RMSPE to Pre-Implementation RMSPE and Leave-One-Out Distribution, Sumedang and Control Districts
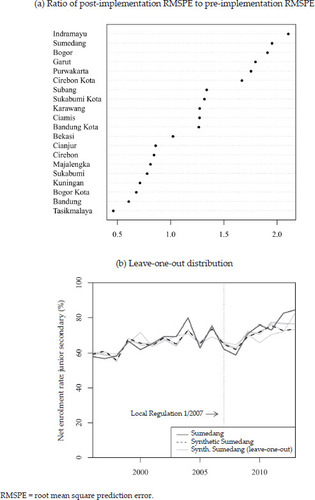
FIGURE 6 Net Junior Secondary School Enrolment Rate for the Fifth Quintile: Ratio of Post-Implementation RMSPE to Pre-Implementation RMSPE and Leave-One-Out Distribution, Sumedang and Control Districts
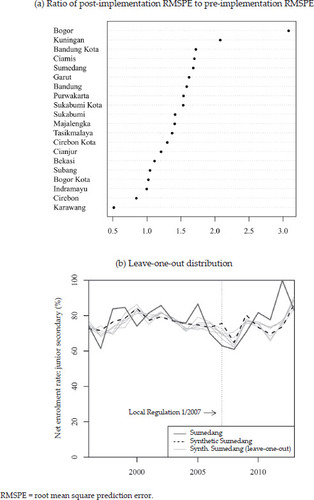
FIGURE 7 Trends in Net Senior Secondary School Enrolment Rate: Sumedang vs Synthetic Sumedang and Placebo Gaps (excludes districts with pre-intervention MSPE five times higher than Sumedang’s)