
Figures & data
Table 1. Total proprietor numbers (000 s) 1851–1881 for 13 sectors.
Table 2. Entrepreneurship rates: total numbers of employers, own account, and all proprietors as percentage of all economically active, 1851–1911.
Figure 1. Comparison of supplementation estimates of proprietor numbers 1851–81, joined to 1891–1911 data, showing the estimation range for alternatives (R: rounded; UR: unrounded; and extrapolation ratios). The chosen supplementation methods are in bold Supplement 1: intelligence-led; Supplement 2: tailored logit. The tagged census responses are shown at the foot for ‘extracted’ 1851–81 (full 1871 data unavailable).
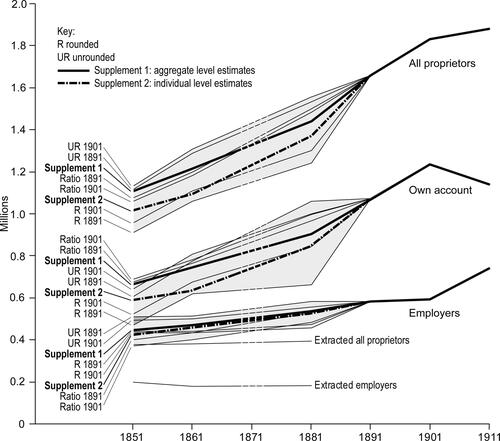
Table A1. Logit estimates for probability of responding as proprietor in 1891; *** p ≥ 0.01; # indicates interaction variables; z-values for the logit are equivalent to t-tests in normal regression.
Figure 2. Total entrepreneur numbers (000 s), 1851–1911, for 13 sectors; using supplement method 1 for 1851–81.
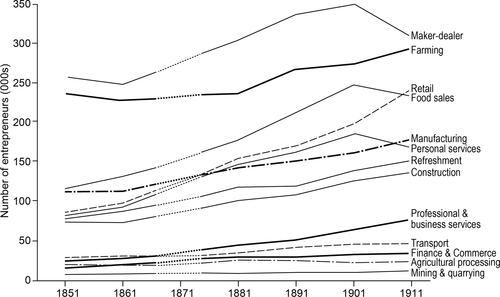
Table 3. Percentage change in number of male and female proprietors by sector 1851–1911.
Figure 3. Male and female entrepreneurship rates 1891–1911 by age, as a percentage of economically active by sex.
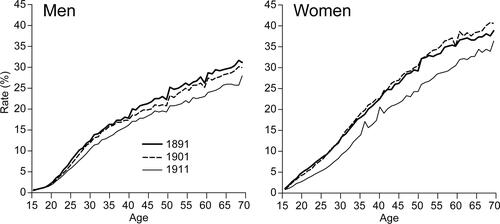
Figure 4. Trends of counts of all businesses in England and Wales listed in ten Post Office and Kelly sector directories for 1869–1922.
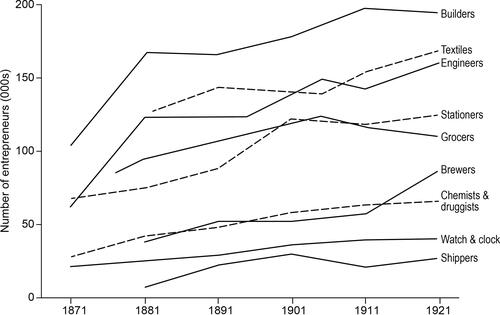
Table 4. Comparison of percentage change in counts for census employers, and directories, 1871–1911 for 23 sample sectors identified by I-CeM Occode number. Sources: 1871–1881 comparison uses extracted tagged employers only; 1881–1901 uses the supplemented data for 1881.
Table 5. Trade directory listings for all proprietors in Devizes and Idle 1881; note sex in directories is sometimes impossible to infer resulting in potential for overestimating males (more precise in Devizes than Idle).
Table 6. Census listing of proprietors in Devizes and Idle 1881: employers extracted and tagged, and after intelligence-led Supplementation 1.
Figure A1. An example of splitting I-CeM occode 697 into sub-occodes for grocers: percent of individuals estimated at each probability level from logit Method 1 for 1851.
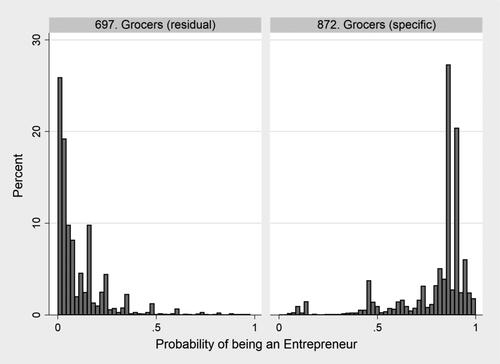
Table A2. Methods used for intelligence-led Supplementation 1 for estimating all proprietors (employers plus own account) by sub-occode for 1881.