Figures & data
Table 1. Major species as function of obtained by integration expressed by Eq. (20).
Figure 1. General form of the Chemkin laminar flame solution.
Figure 2. Local pointers for (a) , (b)
, and (c)
for
,
.
Figure 3. Global pointers for a lean, rich, and stoichiometric ethanol/air oxidation, for .
Table 2. Major species as function of , for
.
Table 3. Major species as function of , for
.
Table 4. Major species for (
),
(
),
(
and
)
Figure 4. Temperature and source term profiles stored in the database obtained with CSP algorithm.
Figure 5. Normalized characteristic time vs. residence time of stoichiometric flame, evaluated with PSR.
Figure 6. Normalized characteristic time vs. residence time of stoichiometric flame, evaluated with PSR.
Figure 7. Source term of all vector databases and temperature profile obtained by
.
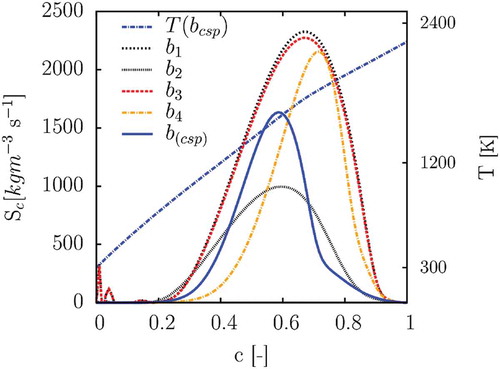
Figure 8. Profiles of temperature, , and intermediate species.
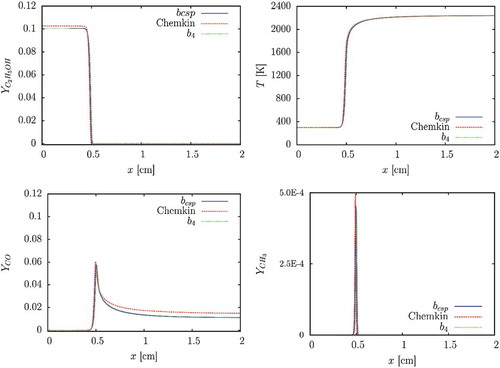
Figure 9. Temperature [K] contours.
![Figure 9. Temperature [K] contours.](/cms/asset/3766adf0-4abd-45e8-b3f1-95f90bc7d622/gcst_a_1316266_f0009_oc.jpg)
Figure 10. CO mole fractions [–].
![Figure 10. CO mole fractions [–].](/cms/asset/e7e8662a-20ca-4a55-a42b-4e2b5d979d48/gcst_a_1316266_f0010_oc.jpg)
Figure 11. Source term [kg m−3s−1] contours.
![Figure 11. Source term [kg m−3s−1] contours.](/cms/asset/d832f3e2-4b87-449a-a767-75474048b474/gcst_a_1316266_f0011_oc.jpg)
Figure A1. Output of CSP/PSR calculation for the definition of the vector.