Figures & data
Figure 1. Diagrams of the cookstoves, (a) Gyapa (GY), mass 8.4 kg; (b) Carbon Zero (CZ), mass 13.9 kg; and (c) Lucia (LC), mass 0.25 kg used in the study. The diagrams are not to scale, dimensions in mm. The pan supports consisted of a wire U-shaped loop positioned 1 cm above the exit of the stove and projecting 1 cm into the stove exit.
Table 1. Proximate and ultimate analysis of the fuels.
Figure 2. Schematic showing experimental arrangement. TC: Thermocouple points.
Table 2. Stove performance indicators.
Figure 4. Emission factors for minor pollutants studied (mass of species/kg of dry fuel). Error bars represent MOE.
Table 3. Ratio of EF (wet wood): EF (dry wood) for oak in the CarbonZero (CZ) and Gyapa (GY) stoves.
Table 4. Emission of particulate matter.
Figure 5. Particle size distributions for dry and wet oak on the CZ stove, charcoal on the GY stove and pellets in the Lucia gasifier stove. The time averaging periods are from the addition of one fuel batch through flaming and smouldering phases until the next fuel batch is added.
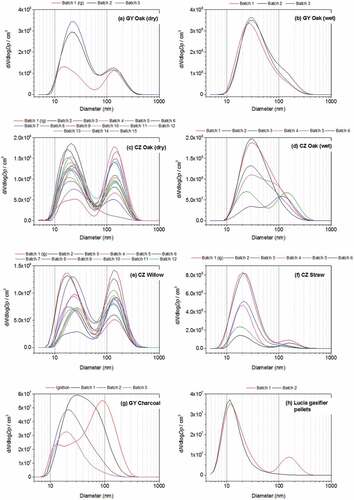
Table 5. Results of the comet assay.
Figure 6. Plot of toxicity (% DNA in tail per mg) as a function of particle number (PN1) emission factor and count median diameter (CMD). Error bars show MOE between repeat tests.
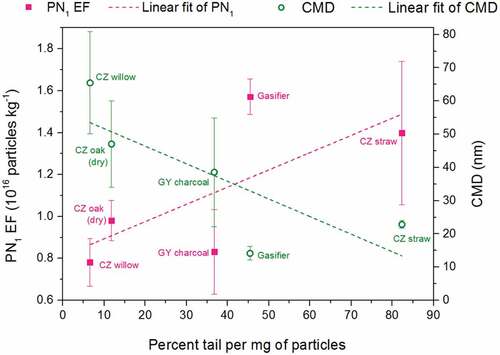
Figure 7. Comparison of emissions factors of this work (red crosses) with literature values. For each stove type, classified as traditional, improved or gasifier, the mean (dot), median (line), 25th and 75th percentiles (box) and range (whisker) are shown. The number of stove/fuel combinations (N) is shown at the top of the panel. The original data and references are given in the supplementary information.
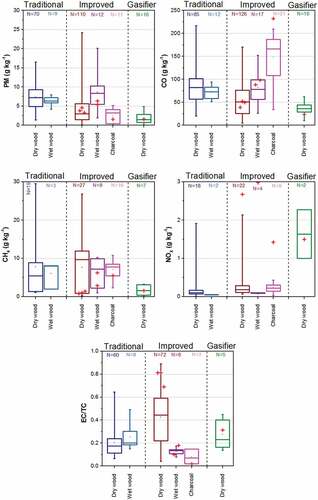
Figure 3. Emissions factors for major pollutants studied (mass of species/kg of dry fuel). Error bars represent MOE. Where error bars are not given only single runs were undertaken.