
Figures & data
Figure 1. A comparison to fuel bed ignition by a non-reacting heater and firebrand showers.
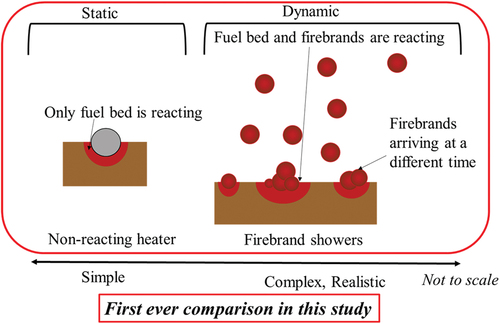
Figure 2. Experimental setting for (a) Ignition with a cartridge heater and (b) Ignition with firebrand showers.
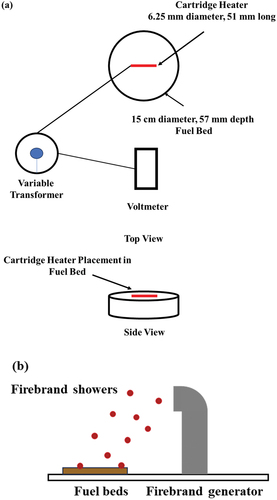
Figure 3. Smoldering ignition (SI) delay time vs heat flux from a cartridge heater.
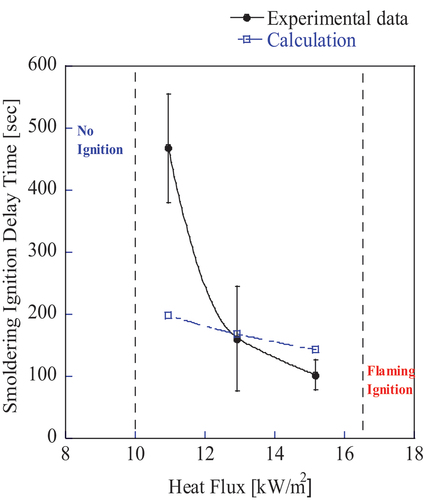
Figure 4. Sensitivity analysis on EquationEquation (5)(5)
(5) .
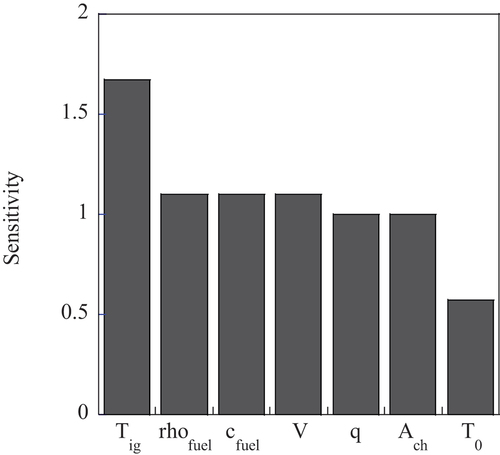
Figure 5. Intervals of arrival time of firebrands vs smoldering ignition delay time, for given SI spot.
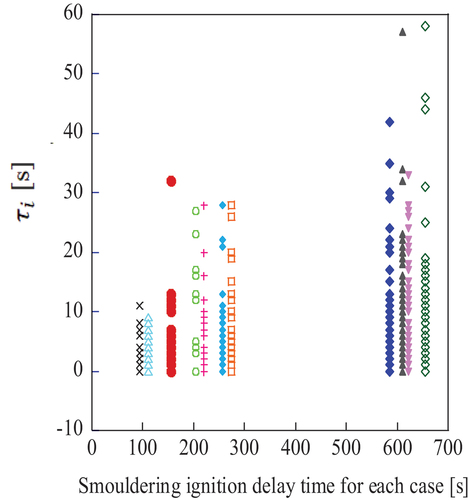
Table 1. Data for EquationEquation (5)(5)
(5) .
Figure 6. Calculated heat contribution from a firebrand to the fuel bed.
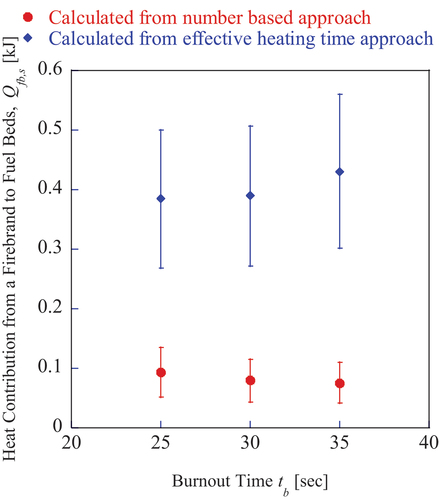
Figure 7. Calculated heat loss from fuel beds to the air.
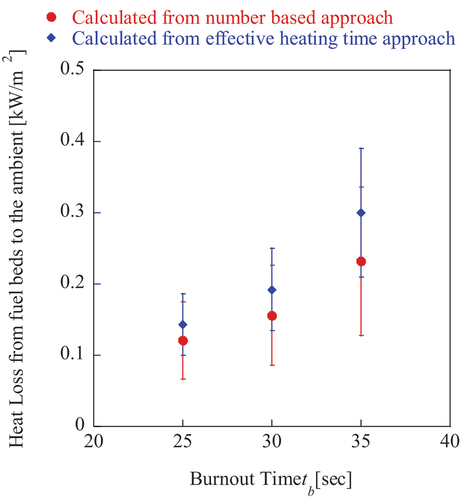
Table 2. R2 value for regression model for .
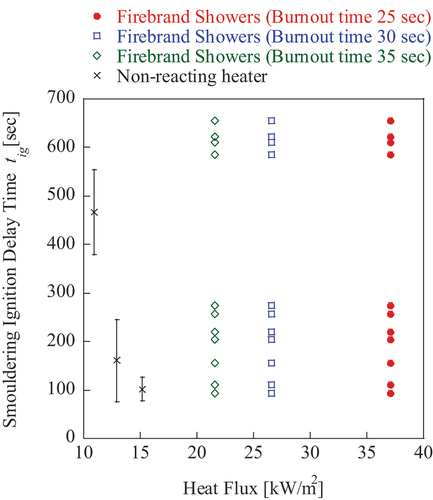
Figure 8. Comparison of smoldering ignition delay time vs heat flux between ignition from a non-reacting cartridge heater to firebrand showers.
Table