285
Views
0
CrossRef citations to date
0
Altmetric
Research Article

Efficient Quantification of Soluble and Insoluble Oxalates in Clay Mineral Mixtures

, , , , , & show all
Pages 1985-1999 | Received 14 Dec 2022, Accepted 26 Mar 2024, Published online: 02 Apr 2024

Figures & data

Table 1. Wavenumbers of IR absorption peaks associated with biominerals CaOx monohydrate (COM), CaOx dihydrate (COD) and NaOx.

Figure 1. Flow chart showing overview of the development of a mid-infrared (MIR) spectroscopic technique to predict oxalate concentrations in new samples using only spectral information. The model is calibrated by correlation between oxalate concentrations and spectral data of a reference dataset. Several models may be developed due to different possible combinations of predictive model components; thus, the best-performing model is selected by validation procedures.
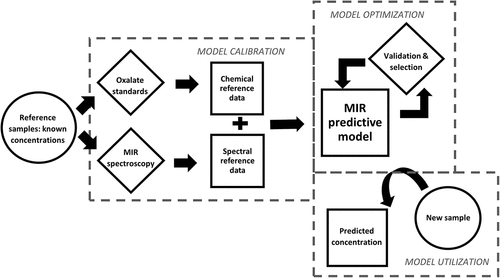
Figure 1. Flow chart showing overview of the development of a mid-infrared (MIR) spectroscopic technique to predict oxalate concentrations in new samples using only spectral information. The model is calibrated by correlation between oxalate concentrations and spectral data of a reference dataset. Several models may be developed due to different possible combinations of predictive model components; thus, the best-performing model is selected by validation procedures.

Table 2. Composition of standard mineral mixtures and oxalic acid solutions.

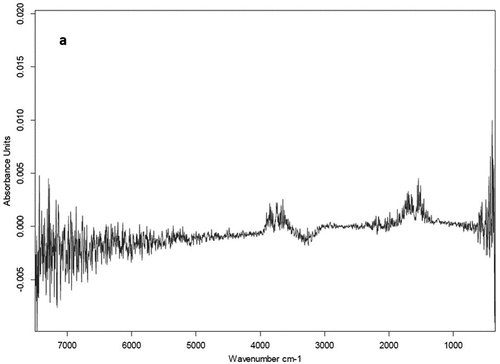
Figure 2. Unprocessed mid-infrared spectra of 0.01 M oxalic acid.

Figure 2. Unprocessed mid-infrared spectra of 0.01 M oxalic acid.

Figure 3. Unprocessed mid-infrared spectra pure solid minerals: calcium oxalate (CaOx, a), sodium oxalate (NaOx, b), kaolinite (c), SiO2 (d), CaCO3 (e) and CaSO4 (f).
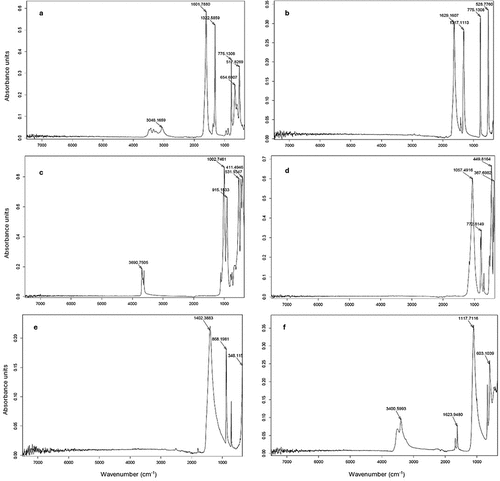
Figure 3. Unprocessed mid-infrared spectra pure solid minerals: calcium oxalate (CaOx, a), sodium oxalate (NaOx, b), kaolinite (c), SiO2 (d), CaCO3 (e) and CaSO4 (f).

Figure 4. Plots for validation of infrared spectral-based models to determine concentrations of (a) calcium oxalate, CaOx and (b) sodium oxalate, NaOx in prepared mineral mixtures. Solid line represents y = x reference line.
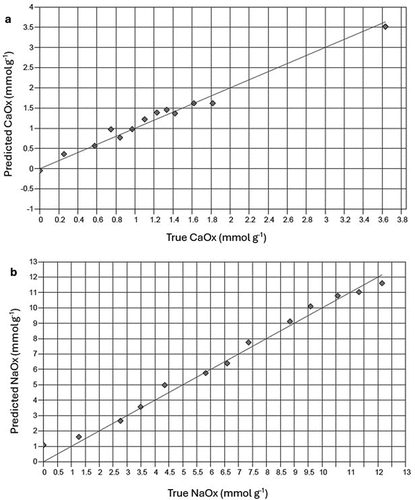
Figure 4. Plots for validation of infrared spectral-based models to determine concentrations of (a) calcium oxalate, CaOx and (b) sodium oxalate, NaOx in prepared mineral mixtures. Solid line represents y = x reference line.

Figure 5. Plots for validation of infrared spectral-based models to determine concentrations of oxalic acid in a standard solution. Solid line represents y = x reference line.
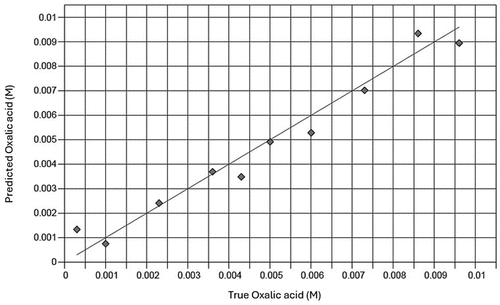
Figure 5. Plots for validation of infrared spectral-based models to determine concentrations of oxalic acid in a standard solution. Solid line represents y = x reference line.

Table 3. Figures of merit for models predicting oxalate components in solid and liquid matrices based on MIR spectra of samples.