Figures & data
Figure 1. Percentage of all pupils of each FSM status, 2011 to 2019 KS4 cohorts.
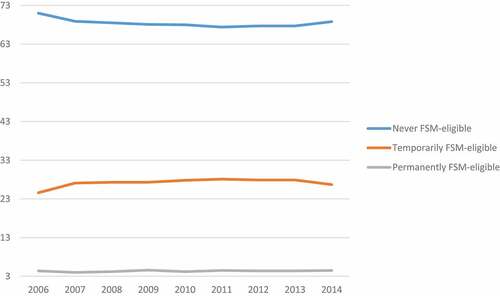
Figure 2. Percentage of all pupils of each FSM status, 2011 to 2019 KS4 cohorts.
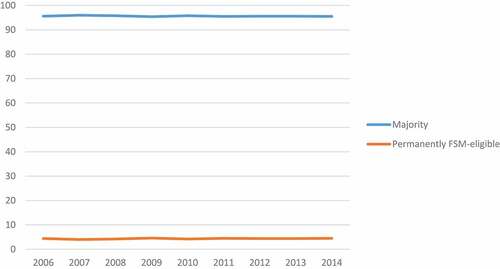
Figure 3. KS2 mean segregation residual for 11 year FSM-eligible pupils, 2006–2014.
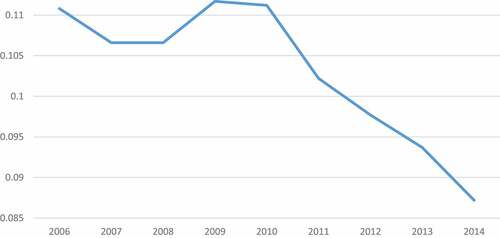
Figure 4. The attainment gap at KS2 between 11 year FSM-eligible pupils and the rest, KS2 2006 to 2014 cohorts.
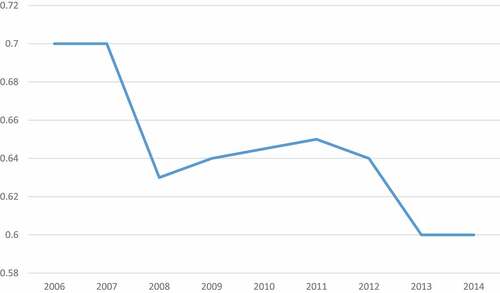
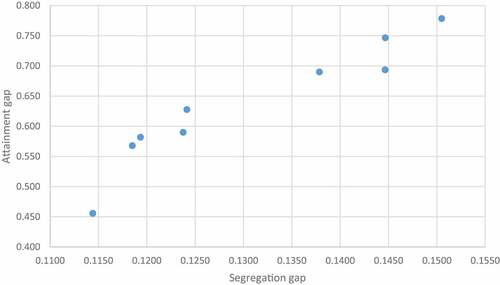
Figure 5. Scatterplot of segregation index and attainment gap, by year.
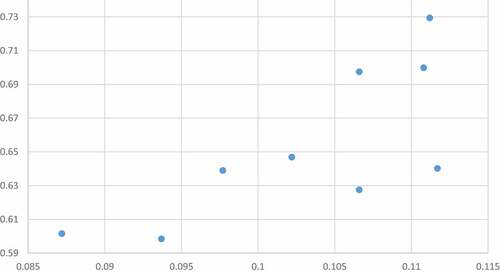
Figure 6. Percentage of SEN pupils also FSM-eligible for 11 years, 2007 to 2014 KS2 cohorts.
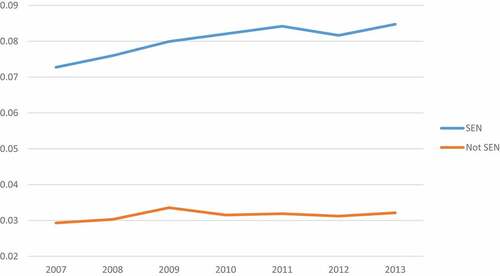
Figure 7. Segregation gap for SEN pupils who are permanently FSM-eligible or not.
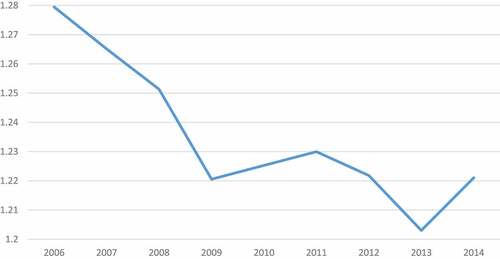
Figure 8. KS2 attainment gap for SEN pupils who are permanently FSM-eligible or not.
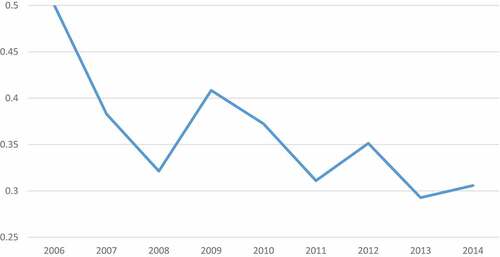
Figure 9. Percentage of each ethnic group also FSM-eligible for 11 years, 2007 to 2014 KS2 cohorts.
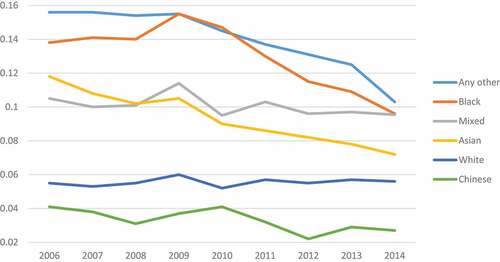
Figure 10. Segregation gap for pupils of each ethnic group who are permanently FSM-eligible, or not.
Note: these are not gaps between ethnic groups, but gaps between long-term poor and others within each ethnic group.
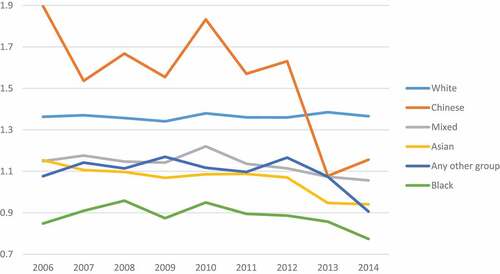
Figure 11. KS2 attainment gap for pupils of each ethnic group who are permanently FSM-eligible, or not.
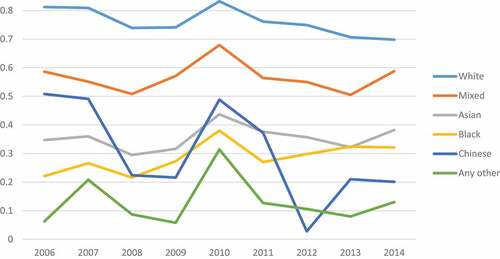
Figure 12. KS2 11 year FSM segregation gap by economic area.
Note: As with all graphs in this paper, the key is in the same order as the appearance of the lines in 2014, from top to bottom
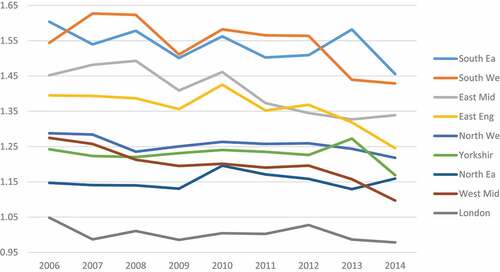
Figure 13. KS2 11 year FSM attainment gap by economic area.
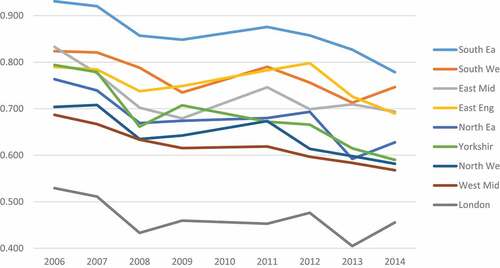
Figure 14. Scatterplot of segregation (x axis) by attainment gap (y axis) for economic areas.