
Figures & data
Table 1. Categories/Range of Key Variables Coded from Studies.
Figure 1. PRISMA Diagram.
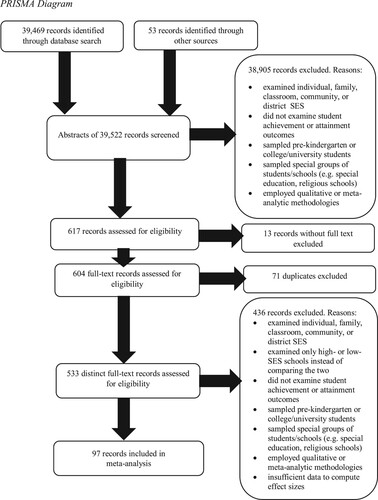
Table 2. Associations between School SES and Student Outcomes.
Table 3. Meta-regression (k = 218).
Table 4. Associations between School SES and (a) Schools’ Percentage of Ethnic Minority Students; (b) Students’ Prior Ability; and (b) School Processes.
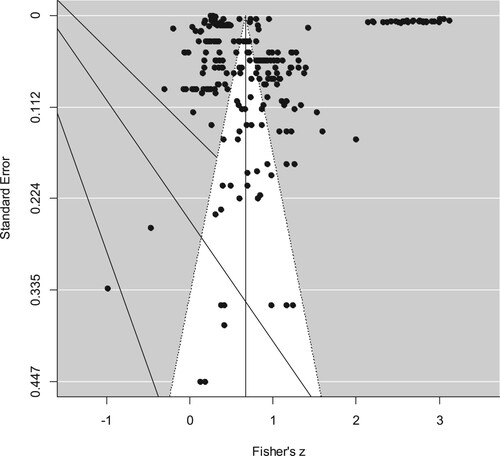
Figure 2. Funnel Plot.
Supplemental material