
Figures & data
Figure 1. PRISMA-ScR flow diagram for identification of studies.
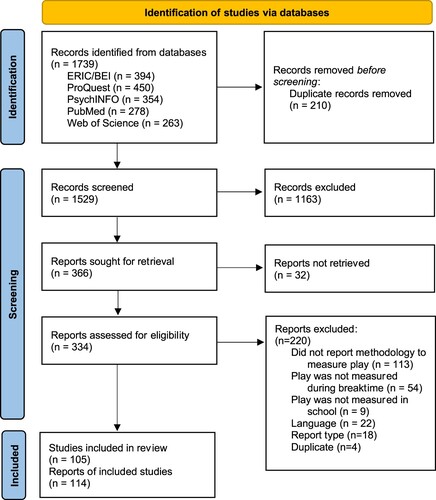
Figure 2. Graph analysis demonstrating frequency and co-occurrence of methodological approaches. Node size represents the frequency of each methodological approach. Edges (lines) between nodes represent that at least one study has used these approaches in combination, and the weight of the edges represents the frequency of each combination. Qualitative approaches are presented in purple (dark grey in print) and quantitative approaches in blue (light grey in print).
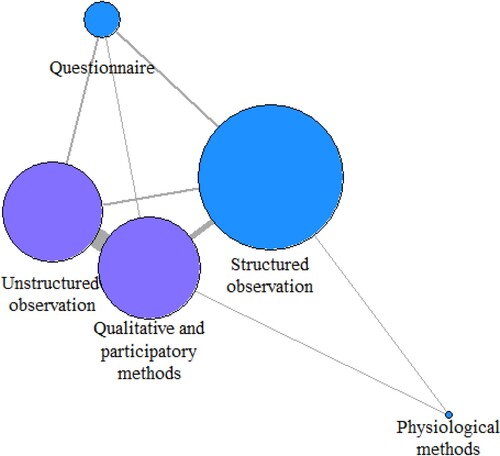
Table 1. Named observation systems used to capture play. Note that these structured observation systems all give rise to quantitative data.
Table 2. Named questionnaires used to capture play.
Supplemental Material
Download Zip (338.3 KB)Data availability statement
Extracted data, the complete list of included reports and metadata files are available from the following Open Science Framework repository https://osf.io/8rga6/?view_only=859bc5b0037746c4a8e6aa8885a072d0.