
Figures & data
Figure 1. The layout of the floor of the parking garage and the the path walked by the participants. There were 57 parking places, as indicated by the numbers.
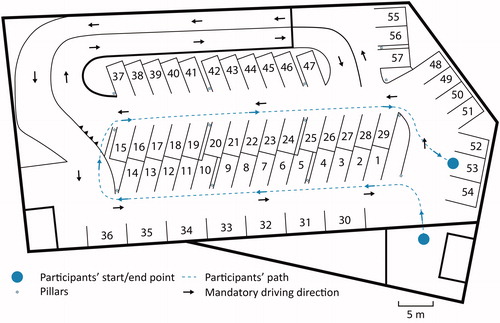
Table 1. Examples of fixations per area of interest.
Figure 2. Boxplot of the normalised number of fixations (NNF). Each circular marker represents one participant (n = 36). The green cross represents the participant mean. One marker for Ground (75.1%) is not shown as it falls outside the range of the y-axis.
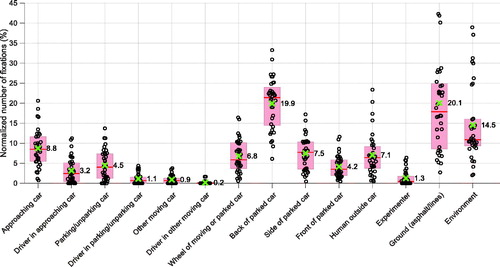
Figure 3. The number of transitions (NT) between AOIs (participants switching attention from ‘Fixation from’ to ‘Fixation to’). The total number of transitions is 12,563, which equals the total number of fixations (12,599) minus the number of participants (36). The numbers on the diagonal represent re-fixations on the same AOI.
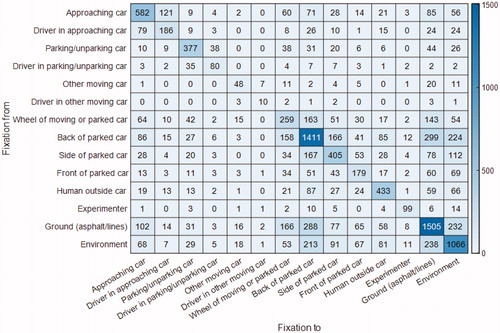
Figure 4. The normalised number of transitions (NNT) between AOIs. The normalisation was performed according to the expected number of transitions if totally random sampling were used (with diagonal removed). The data for the category ‘driver in other moving car’ was omitted because of the small number of fixations. The depicted numbers were multiplied with a constant C, so that they add up to 100%.
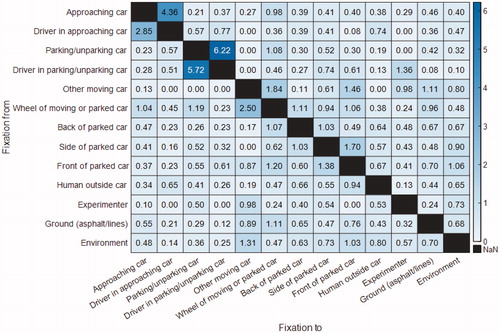
Figure 5. Left: Head yaw rate of a participant with a low head movement index (11.3 deg/s). Right: Head yaw rate of a participant with a high head movement index (27.4 deg/s). A positive value indicates a rotational velocity towards the left.
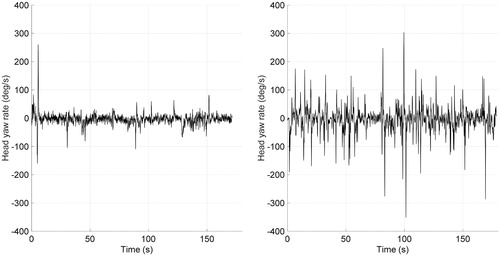
Figure 6. Correlation between head movement index and normalised number of fixations (n = 36). The error bars represent 95% confidence intervals.
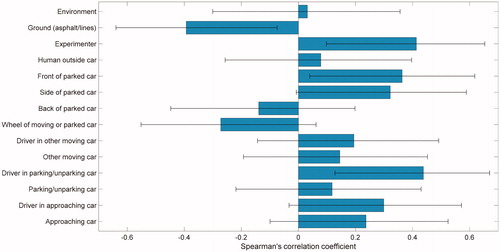
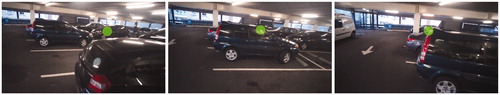
Figure 7. Example of a participant tracking a car behind parked cars.
Supplemental Material
Download MS Word (252.3 KB)Data availability statement
Raw data and MATLAB code used for the analysis is available at https://doi.org/10.4121/13488384