
Figures & data
Figure 1. Conceptual research model.
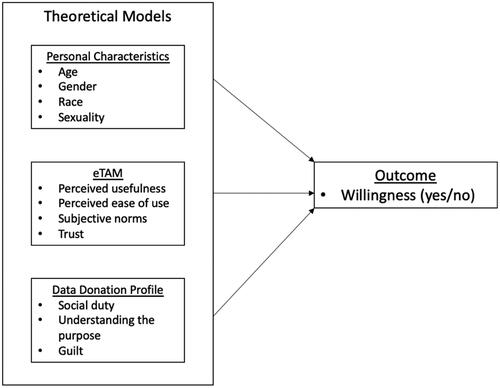
Table 1. Descriptive and reliability statistics of scales.
Table 2. Logistic regression.
Table 3. Primary qualitative themes.
Table A1. Extended technology acceptance model items.
Table B1. Data donation items.
Table C1. Scenarios.
Table D1. Pearson correlation coefficients.