Figures & data
Figure 1. Barium titanate ceramic sample and its support in the high-temperature impulse excitation equipment (RDFA 23 and HT 1600. IMCE, Belgium); the alumina tube in the center contains the alumina projectile that hits the sample in free flight and thus excites the flexural vibration.
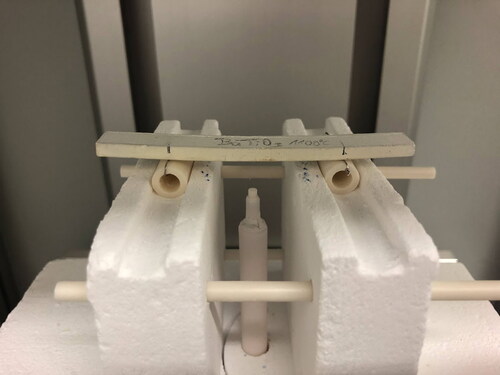
Figure 2. X-ray diffractogram of the barium titanate sample after firing.
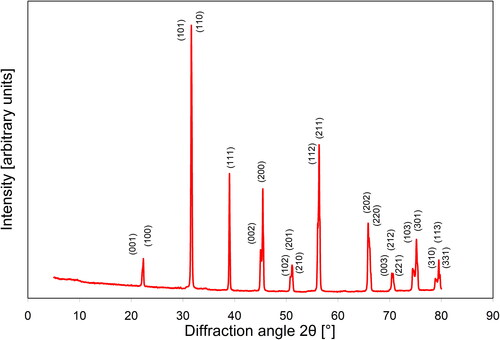
Figure 3. Measured room temperature value of Young’s modulus of porous barium titanate ceramics (porosity 0.331), compared to the common theoretical predictions (from top to bottom: upper Paul bound/Voigt bound, upper Hashin-Shtrikman bound, Gibson-Ashby/GA power-law prediction, Pabst-Gregorová/PG exponential prediction and Pabst-Uhlířová/PU benchmark relation.
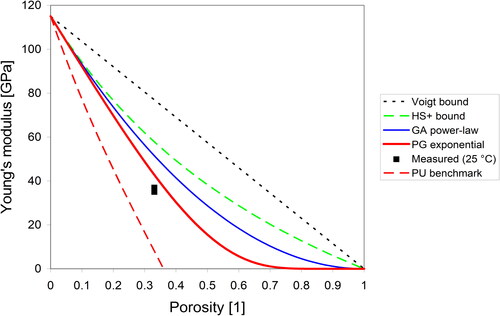
Figure 4. Temperature dependence of Young’s modulus of porous barium titanate ceramics (porosity 0.331), measured for two complete heating-cooling cycles; full symbols heating (up), empty symbols cooling (down).
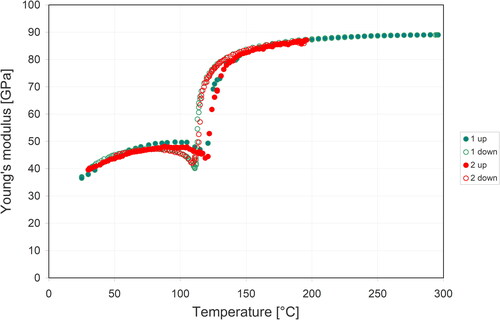
Figure 5. Fit (according to Levanyuk’s theory) of the temperature dependence of Young’s modulus of porous barium titanate ceramics (porosity 0.331) above the Curie temperature, measured during heating (first heating-cooling cycle).
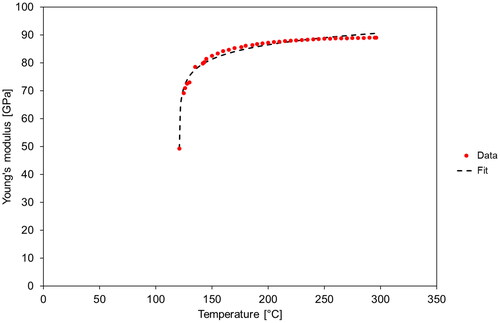
Figure 6. Fit (according to Levanyuk’s theory) of the temperature dependence of Young’s modulus of porous barium titanate ceramics (porosity 0.331) above the Curie temperature, measured during cooling (first heating-cooling cycle).
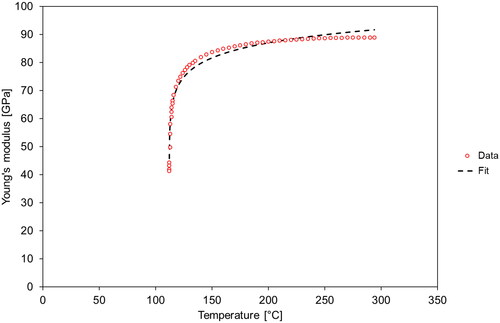
Figure 7. Fit (according to Levanyuk’s theory) of the temperature dependence of Young’s modulus of porous barium titanate ceramics (porosity 0.331) above the Curie temperature, measured during heating (second heating-cooling cycle).
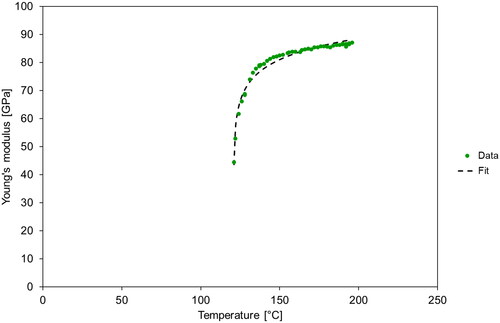
Figure 8. Fit (according to Levanyuk’s theory) of the temperature dependence of Young’s modulus of porous barium titanate ceramics (porosity 0.331) above the Curie temperature, measured during cooling (second heating-cooling cycle).
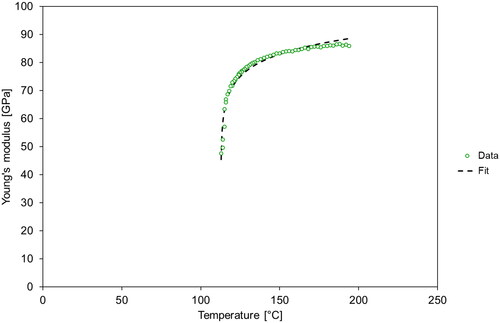
Table 1. Fit parameters obtained by fitting the temperature dependence of Young’s modulus in the paraelectric (high-temperature) phase of BT ceramics according to Levanyuk’s theory.
Figure 9. Temperature dependence of Young’s modulus for two quartz sandstone samples (denoted I and II), each measured twice (denoted 1 and 2).
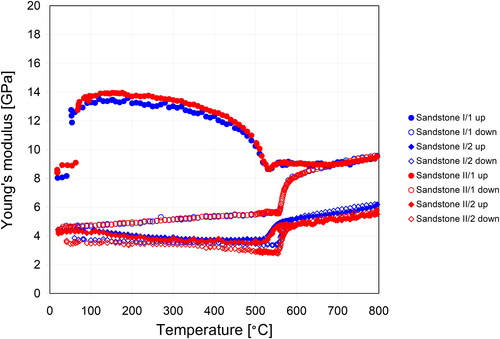
Figure 10. Temperature dependence of damping (quantified via the inverse quality factor) of porous barium titanate ceramics (porosity 0.331), measured for two complete heating-cooling cycles; full symbols heating (up), empty symbols cooling (down).
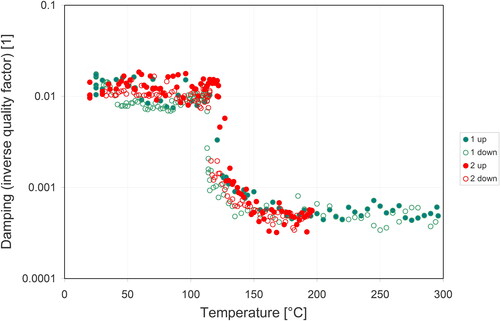
Table 2. Fit parameters obtained by fitting the temperature dependence of Young’s modulus in the paraelectric (high-temperature) phase of quartz sandstone according to Levanyuk’s theory.
Figure 11. Temperature dependence of Young’s modulus of porous barium titanate ceramics (porosity 0.331), measured for six complete heating-cooling cycles; full symbols heating (up), empty symbols cooling (down).
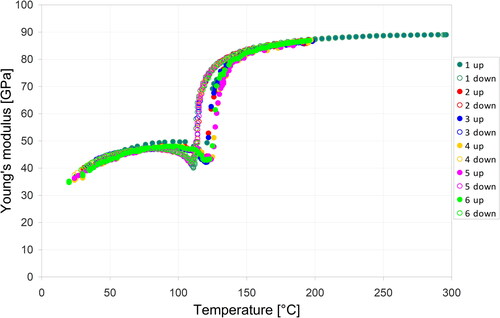
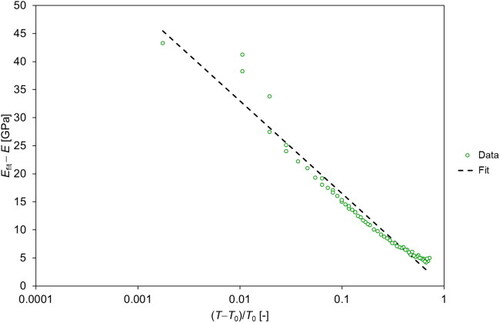
Figure A1. Semi-logarithmic graph of the temperature dependence of Young’s modulus of porous barium titanate ceramics (porosity 0.331) above the Curie temperature fitted according to Levanyuk’s theory; heating branch of the first heating–cooling cycle.
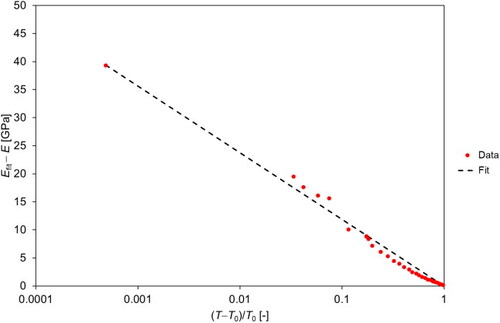
Figure A2. Semi-logarithmic graph of the temperature dependence of Young’s modulus of porous barium titanate ceramics (porosity 0.331) above the Curie temperature fitted according to Levanyuk’s theory; cooling branch of the first heating–cooling cycle.
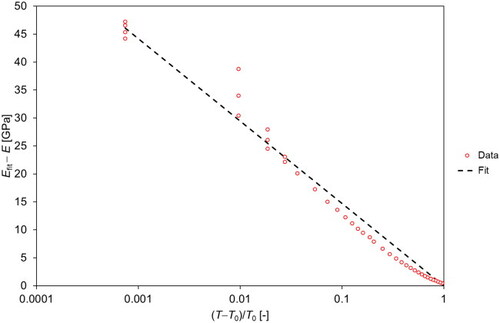
Figure A3. Semi-logarithmic graph of the temperature dependence of Young’s modulus of porous barium titanate ceramics (porosity 0.331) above the Curie temperature fitted according to Levanyuk’s theory; heating branch of the second heating–cooling cycle.
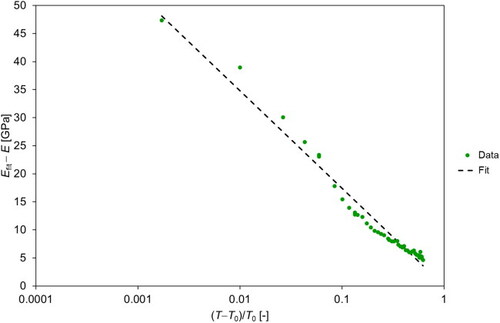
Figure A4. Semi-logarithmic graph of the temperature dependence of Young’s modulus of porous barium titanate ceramics (porosity 0.331) above the Curie temperature fitted according to Levanyuk’s theory; cooling branch of the second heating–cooling cycle.