Figures & data
Figure 1. MPS average for the years 2010‒2014. A. Cupressaceae in Córdoba. B. Cupressaceae in Tulsa. C. Quercus in Córdoba. D. Quercus in Tulsa. E. Poaceae in Córdoba. F. Poaceae in Tulsa. Note: The average peaks (day and values) in the text boxes were calculated from the peaks for each year and do not correspond to the scale on the X and Y axes.
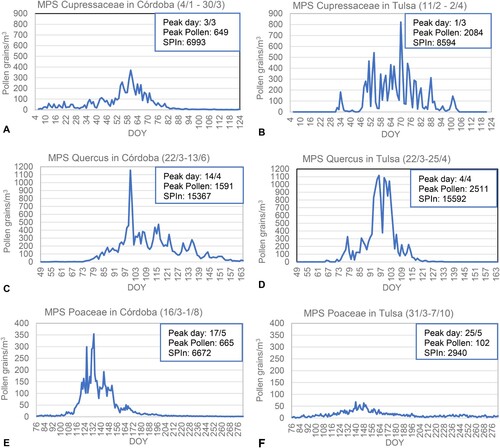
Table I. Pre-peak and post-peak periods of pollen concentration for years 2010‒2014.
Figure 2. Average meteorological parameters during the study period. A. Mean monthly temperature. B. Mean monthly relative humidity. C. Mean monthly rainfall.
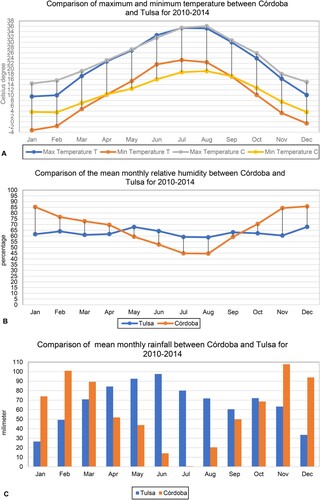
Table II. Pearson correlations coefficient between Cupressaceae pollen and meteorological parameters in the same days (first line) and the previous day's meteorological parameters (second line).
Table III. Pearson correlations coefficient between Quercus pollen and meteorological parameters in the same days (first line) and the previous day's meteorological parameters (second line).
Table IV. Pearson correlation coefficient between Poaceae pollen and meteorological parameters in the same days (first line) and the previous day's meteorological parameters (second line).
Table V. Multiple regression models for the Cupressaceae pollen concentration with the same day (first line) and the previous day (second line). For model validation, the predicted and observed concentrations were analyzed with Pearson correlation.
Table VI. Multiple regression models for the Quercus pollen concentration with the same day (first line) and the previous day (second line). For model validation, the predicted and observed concentrations were analysed with Pearson correlation.
Table VII. Multiple regression models for the Poaceae pollen concentration with the same day (first line) and the previous day (second line). For model validation, the predicted and observed concentrations were analyzed with Pearson correlation.
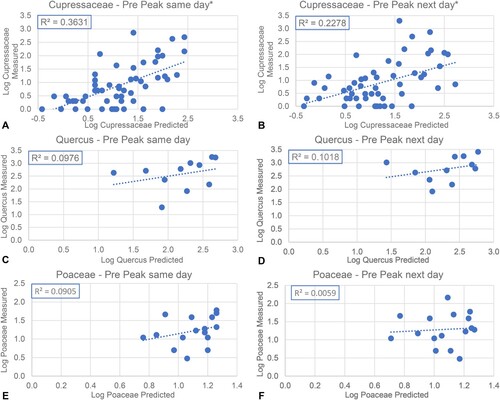
Figure 3. Comparison between measured and predicted pollen during the pre-peak period in Córdoba. A. Cupressaceae same day. B. Cupressaceae next day. C. Quercus same day. D. Quercus next day. E. Poaceae same day. F. Poaceae next day.
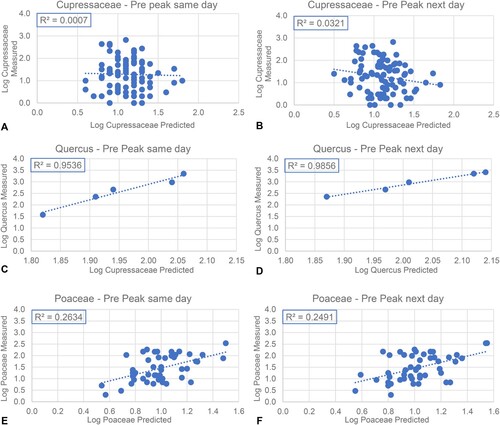
Figure 4. Comparison between measured and predicted pollen during the pre-peak period in Tulsa. A. Cupressaceae same day. B. Cupressaceae next day. C. Quercus same day. D. Quercus next day. E. Poaceae same day. F. Poaceae next day. *The maximum temperatures were close to 0 °C or even lower; hence the three points were negative.