
Figures & data
Figure 1. The process of mathematical modeling (Miwa, Citation1986a, p. 402)
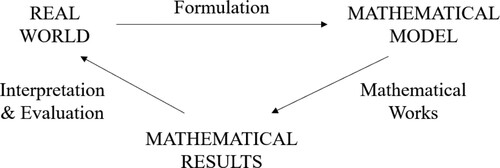
Figure 2. Mathematical modeling cycle in this study (Maaβ, Citation2006, p. 115)
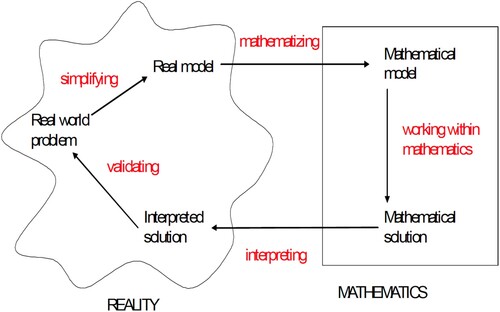
Figure 3. Water bottle display (Stillman, Citation2015, p. 50)
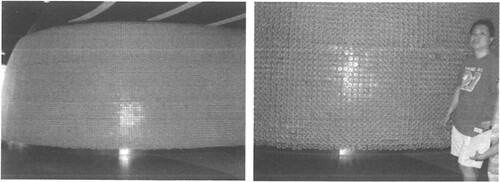
Figure 4. Sprinklers in the schoolyard of X Junior High School (Google, Citationn.d. Map A)
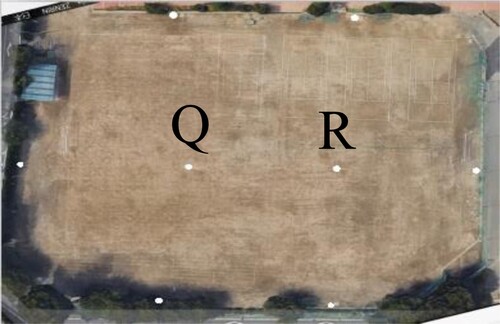
Figure 5. Types of sprinklers (left side: sitting type, right side: embedded type)
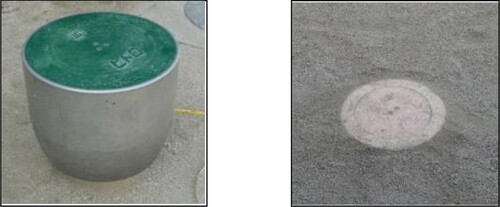
Figure 6. Catalog data of Company H (right: water pressure, left: watering radius)
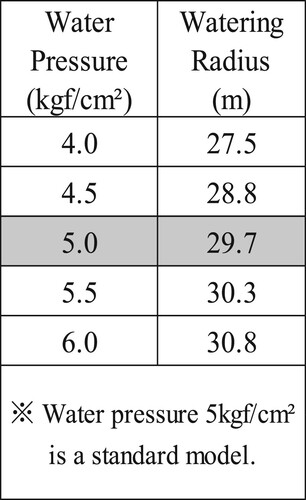
Figure 7. Sprinklers in action
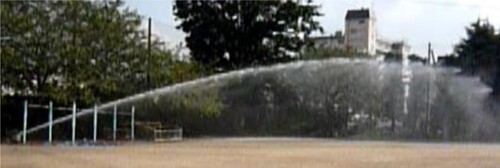
Figure 8. Watering range, seen from above
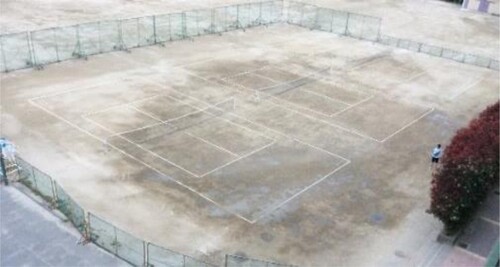
Figure 9. Rectangular Model (Google, Citationn.d. Map B)
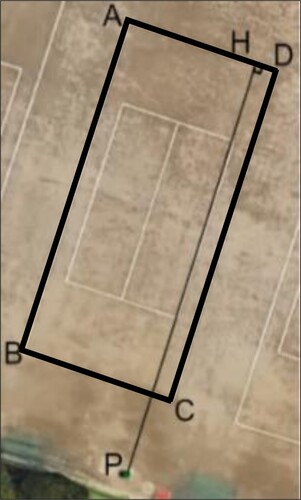
Figure 10. Watering range of the circular model (left: current, right: after repair [Google, Citationn.d. Map A])
![Figure 10. Watering range of the circular model (left: current, right: after repair [Google, Citationn.d. Map A])](/cms/asset/c8c2d7f8-63f6-4ea3-854f-e3592549813a/tmes_a_1977402_f0010_oc.jpg)
Figure 11. Water distribution model of the sitting type based on the data of Company H
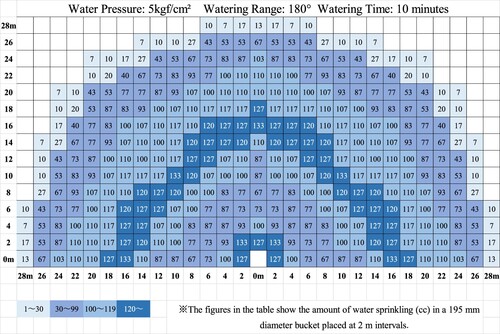
Figure 12. The water distribution model I (Current situation; right: An enlarged part of the left side)
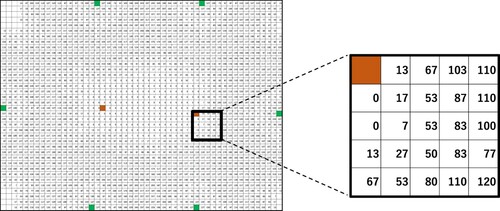
Figure 13. The water distribution model II (left: current, right: after repair)
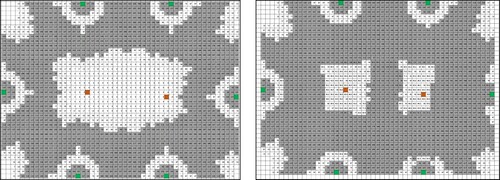
Table 1. Proportion that receives 90 cc or more of water to x minute (current situation)
Table 2. Proportion that receives 90 cc or more of water to x minute (after repair)
Figure 14. Proportional model (x: minutes, y: %; left: current situation, right: after repair)
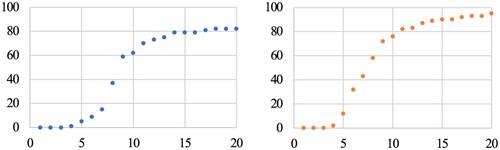
Figure 15. A series of experimental processes
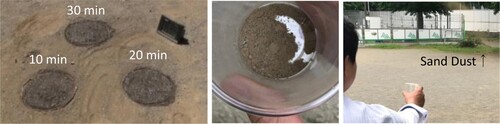
Table 3. The presence or absence of sand dust when pouring the sand sprayed with water collected in a cup.
Figure 16. Amount of water used per minute (L/min)
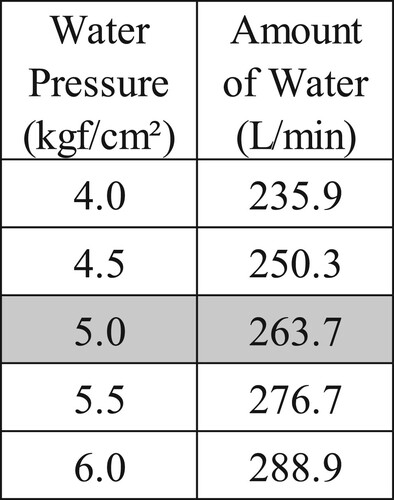
Figure 17. Judgment model for repairs (x: %, y: ten million yen; dotted line: no repair, solid line: with repair)
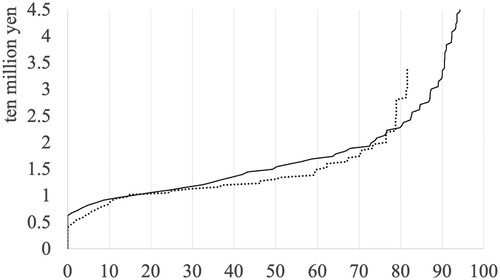
Figure 18. Water distribution model of each situation (upper left: one sprinkler, lower left: two sprinklers, lower right: failure) and the proportion model of one embedded type sprinkler (x: minutes, y: %)
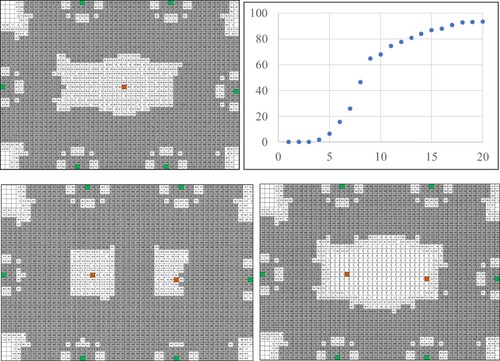
Figure 19. Body pressure distribution model (Fujimaki, Citation2005, p. 11)
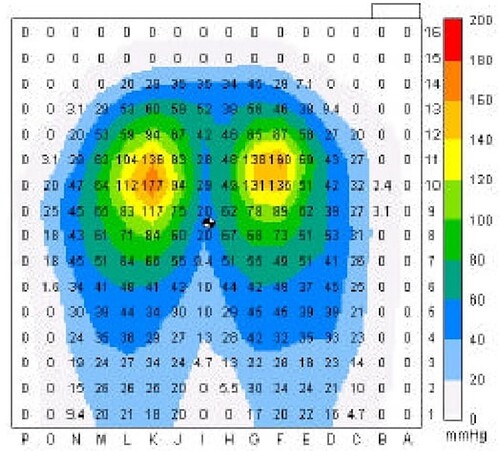
Table 4. Construction of teaching and learning principle of mathematical modeling with an emphasis on generating questions