
Figures & data
Figure 1. Proportion of mathematics enrolment in year 12. Based on data from Wienk (Citation2022).
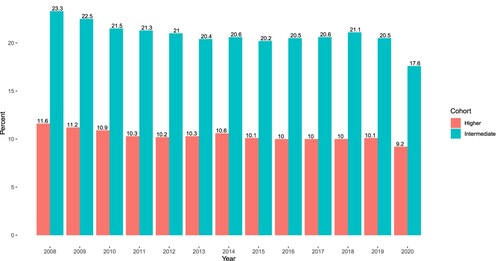
Table 1. List of variables in the data.
Table 2. Summary of successful completion by highest level of mathematics taken in university and high school.
Table 3. Summary of completion by highest mathematics marks in university and high school.
Table 4. Significant variables for model for WAM.
Table 5. Significant variables for model with EngUG completion as response.
Table 6. Significant variables for model with MPE as response.
Table 7. Loadings for first three principal components.
Figure 2. Plot of PC3 against PC1. Colour indicates high school mathematics unit and plotting symbol completions status (C = completed, D = not completed).
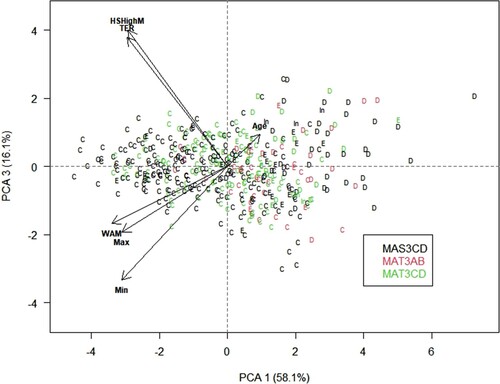
Table 8. Completion status by high school mathematics unit.
Figure 3. Plot of WAM against high school mathematics marks by clusters: (a) completion status by cluster and (b) high school mathematics unit by cluster.
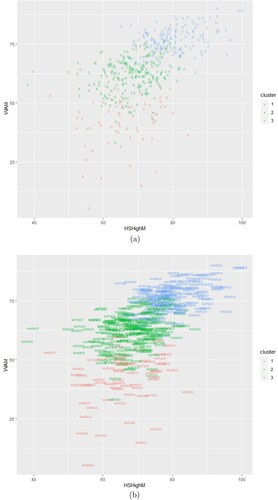
Table 9. Summary of clusters by key variables.
Table 10. List of variables from the survey.
Table 11. Summary of undergraduate student characteristics and completion intention.
Figure 4. Bar graph of main mathematics attitudes questions.
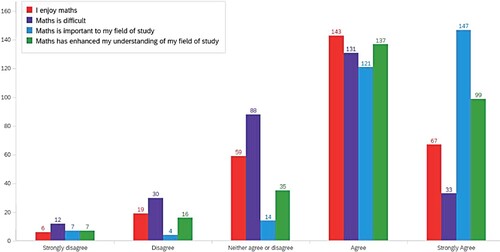
Table 12. Significant variables from fitting logistic model with Importance as response.
Table 13. Significant variables from fitting logistic model with IntendEngUG as response.
Table 14. Significant variables from fitting logistic model with IntendMPE as response.