
Figures & data
Figure 1. CONSORT Flow chart for study participants.
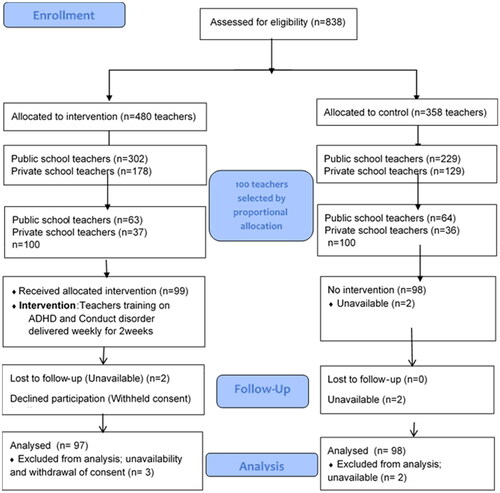
Table 1. Socio-demographic characteristics of participants in intervention and control groups.
Table 2. Between-group comparison of baseline scores on outcome measures.
Table 3. Between-group comparison of post-intervention scores on outcome measures.
Table 4. Analysis of covariance (ANCOVA) results and effect sizes.
Data availability statement
The authors confirm that the data supporting the findings of this study are available within the article.