
Figures & data
Figure 1. MWM test and fasting blood glucose level of rats. (A) Swimming track of rats on day 5 of the place navigation test; (B) Swimming track of rats during the spatial probe test; (C) The escape latency of rats during the place navigation test; (D) Time spent in the platform quadrant of rats during the spatial probe test; (E) Platform crossing times of rats during the spatial probe test. (F) Fasting blood glucose level of rats. All data are expressed as means ± standard error. n = 8 rats per group. *p < 0.05, **p < 0.01, versus Control group.
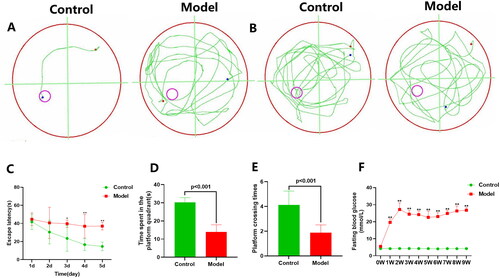
Figure 2. Morphological changes in the hippocampal CA1 area. (A) H and E staining of the hippocampal CA1 area. Upper lane, Scale bar = 100 μm, magnification × 200. (the inside area of the black rectangle. Scale bar = 50 μm, magnification × 400); (B) Nissl staining of the hippocampal CA1 neurons. Upper lane, Scale bar = 100 μm, magnification × 200. (the inside area of the black rectangle. Scale bar = 50 μm, magnification × 400); (C) TEM of the hippocampal CA1 neurons. Scale bar = 5 μm, magnification × 6000, mitochondria (red arrow), rough endoplasmic reticulum (black arrow). n = 2 rats per group.
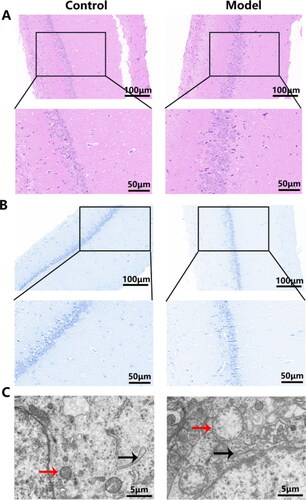
Figure 3. Identification of DEPs in hippocampal tissues. (A) a volcano plot of quantified proteins when FC > 1.2; (B) Subcellular location; (C) Hierarchical clustering analysis of DEPs; (D) Bubble chart of the top 20 enriched domains. The abscissa represented rich factor, rich factor was defined as the number of DEPs annotated in the domain name divided by the total number of all identified proteins in the corresponding domain name. The color of bubble indicated the significance of enriched domain name and the color closer to red indicated greater significance. n = 3 rats per group.
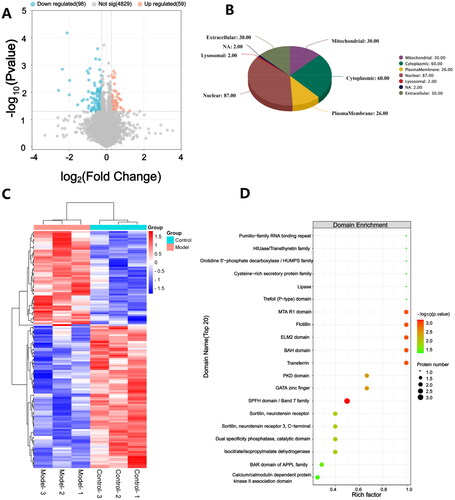
Figure 4. GO and KEGG analysis of DEPs. The figure includes bubble chart of (A) biological processes, (B) cellular components, (C) molecular functions, and (D) KEGG pathways. n = 3 rats per group.
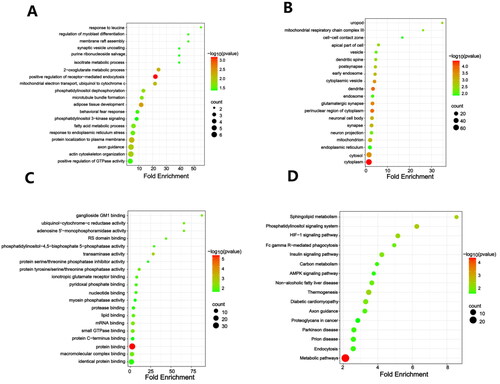
Figure 5. Comparison of protein expression by 4D label-free quantitative proteomics and PRM. n = 3 rats per group.
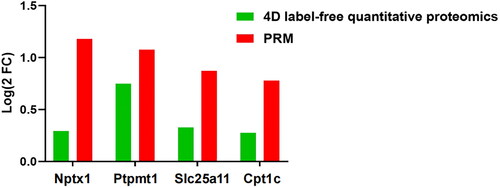
Table 1. Relative expression levels of selected proteins measured via PRM.
Supplemental Material
Download MS Excel (59.8 KB)Availability of data and materials
All the data associated with this article can be found in the article and Supplementary material.