Figures & data
Figure 1. Production System of the Simulation Model with routing, processing time distributions and demand interarrival time distributions.
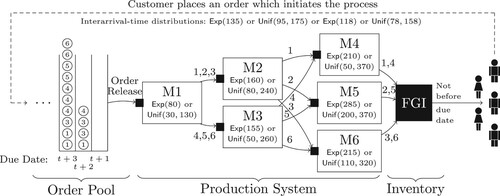
Figure 2. Setting adaptive lead times.
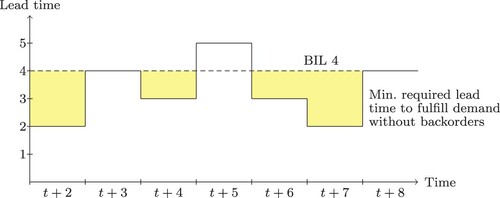
Figure 3. Safety lead time under the assumption of normally distributed deviations of the flow time forecasts.
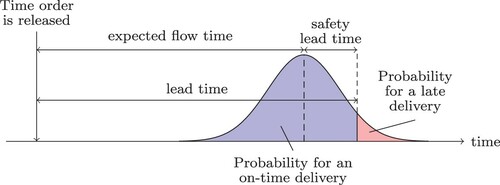
Figure 4. The artificial neural network architecture.
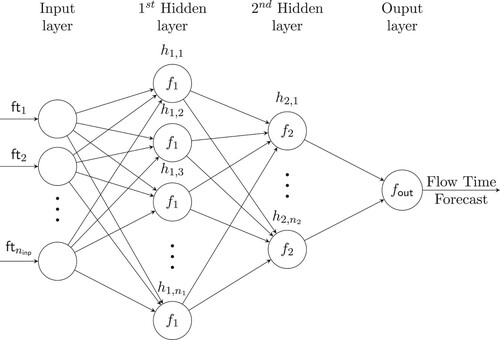
Table 1. Result of feature selection for bottleneck products (top) and non-bottleneck products (bottom), where features with  -significance are printed in bold.
Figure 5. Flow time forecast accuracy of all products for all scenarios.
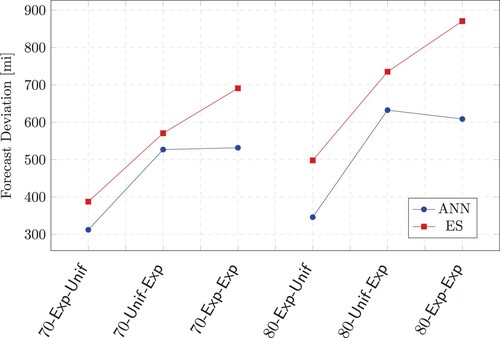
Table 2. Results for a bottleneck utilisation of 70%.
Table 3. Results for a bottleneck utilisation of 80%.
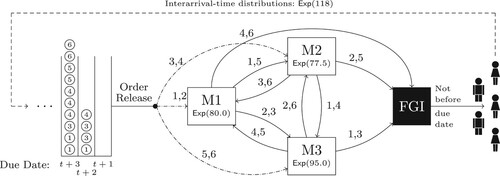
Figure 6. Job Shop Simulation Model with routing, processing time distributions and demand interarrival time distributions.