
Figures & data
Table 1. A summarised review of previous studies using SEM or AI.
Table 2. A summarised review of previous studies using the hybrid method of SEM and ANN.
Figure 1. An illustrative research methodology map.
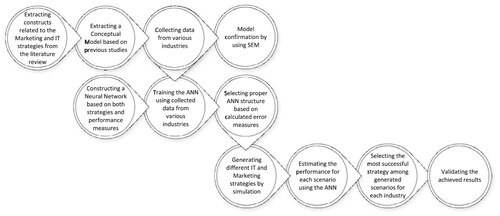
Figure 2. SEM research model.
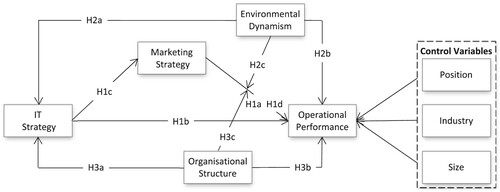
Figure 3. ANN model for the structural equation modelling.
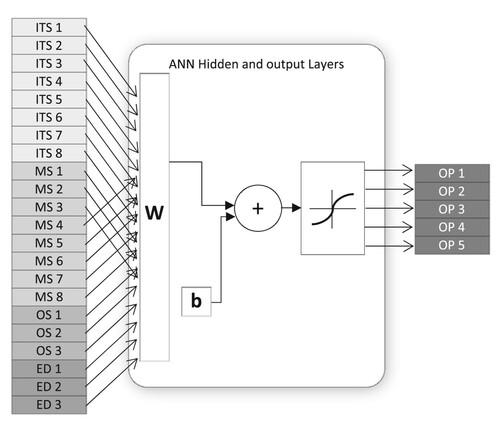
Table 3. Measurements.
Table 4. Overview of indicators and measures of reliability and validity.
Table 5. Cross loadings.
Table 6. Inter-construct correlations and square root of AVE.
Figure 4. Full SEM model.
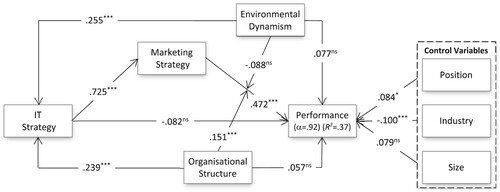
Table 7. Path coefficient and moderation effect.
Table 8. Mediation effect.
Table 9. Summary results of hypotheses testing.
Figure 5. The structure of the applied neural network for OP.
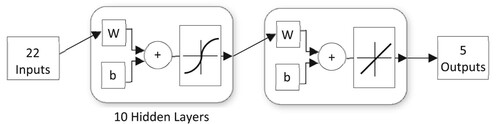
Table 10. Experiments result to construct a proper neural network.
Figure 6. A schematic flowchart of processes to extract the optimal strategy for each business sector based on the neural network.
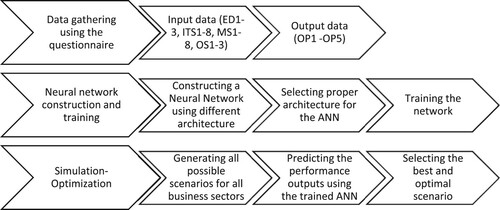
Table 11. Optimal strategy for each industry according to their performance level using the trained ANN.
Table 12. Optimal marketing and IT strategy for each industry based on its performance level.
Figure 7. The percentage of the best strategy among business sectors.
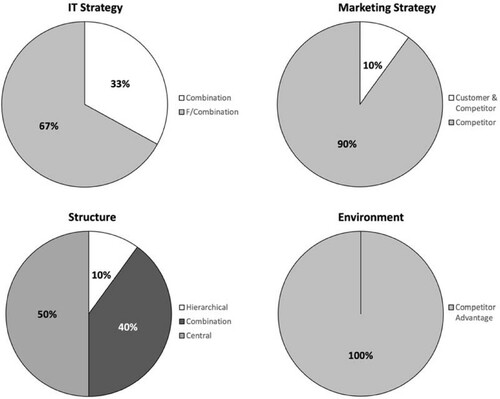
Table 13. Current and optimal strategies in the follow-up analysis among selected industries.