
Figures & data
Table 1. A brief overview of the existing literature on clamping sequence studies with research gap identification.
Figure 1. (a) A representative non-ideal complaint sheet-metal sub-assembled part used in the study along with four classified zones (b) the location of the clamps, the locator pins (XYZ1 and Z2) and RPS alignment.
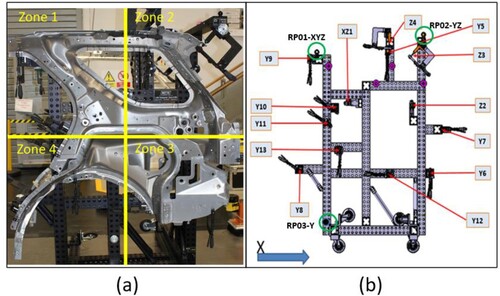
Figure 2. The measurement systems used in this study (a) A horizontal arm CMM, (b) a Laser Tracker.
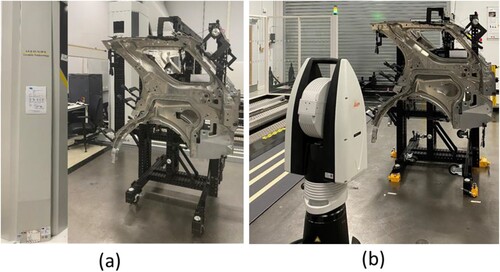
Figure 3. Effect of the clamping sequence on measurement repeatability for 16 points measured using a Laser Tracker.
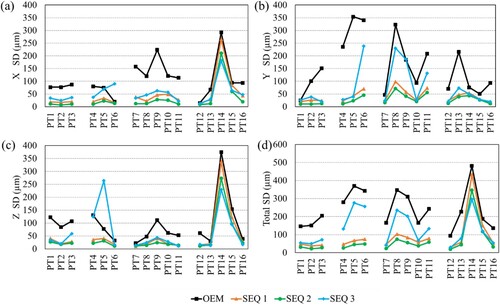
Figure 4. Effect of the clamping sequence on region-specific measurement repeatability, calculated by adding up SD of the points located within the same region. These are obtained from the Laser Tracker measurement results.
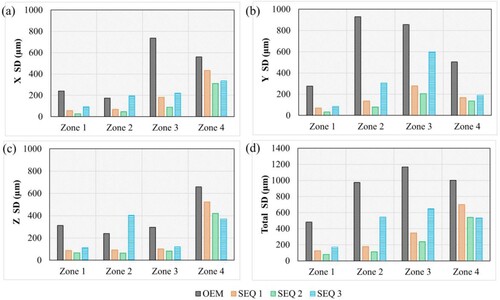
Figure 5. Effect of the clamping sequence on measurement repeatability for 18 features measured using a CMM touch probe.
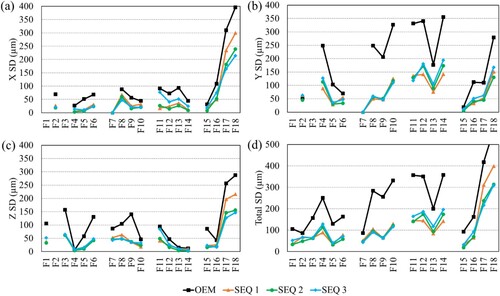
Figure 6. Effect of the clamping sequence on region-specific measurement repeatability, which was calculated by adding up the SD of the feature located within the same region. These are obtained from the CMM touch probe measurement results.
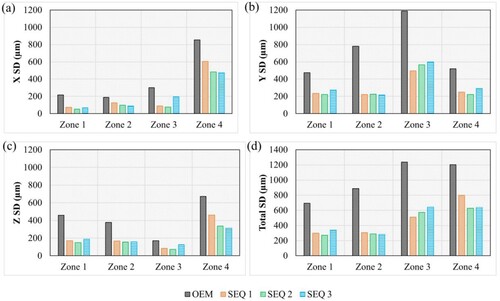
Figure 7. Effect of the clamping sequence on measurement bias for the 18 features measured using a CMM touch probe.
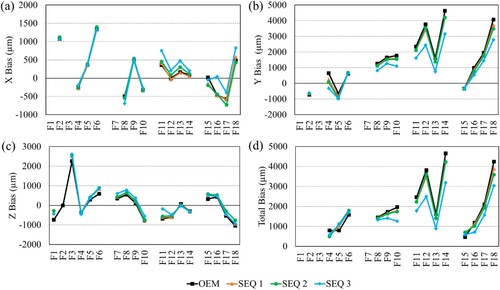
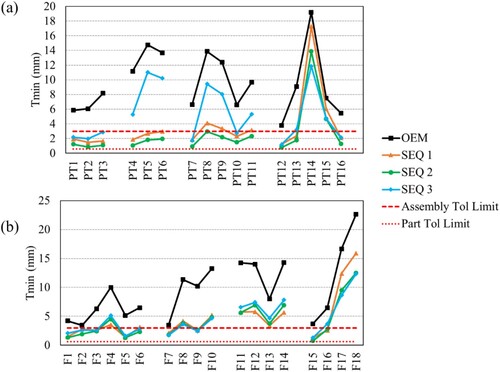
Figure 8. Effect of clamping sequences on the minimum tolerances (Tmin) that the measurements system would be capable of measuring when the limit of Cgk value was considered as 1.33 i.e. to maintain 8 SD (±4 SD) measurement repeatability.
Data availability statement
Data is available on request from the authors.