
Figures & data
FIGURE 1 Attitudes toward civil liberties over time (%).*
*See for the coding of the depicted variables. Bars show these attitudes for the years 1985, 1990, 1996, 2006, and 2016. The right-most bars thus equals the values of . Source: ISSP.
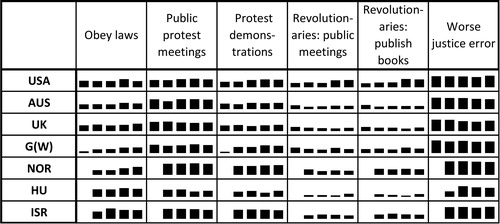
TABLE 1 ROG 2016. Attitudes Toward Civil Liberties (in %)Table Footnote*
FIGURE 2 Attitudes toward state intervention in the economy over time.*
*See for the coding of the depicted variables. Bars show these attitudes for the years 1985, 1990, 1996, 2006, and 2016. The right-most bars thus equals the values of . Source: ISSP.
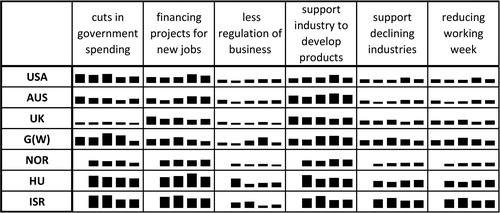
TABLE 2 ROG 2016. Attitudes toward State Intervention in the Economy (in %)Table Footnote*
FIGURE 3 Attitudes toward government spending over time.*
*See for the coding of depicted variables. Bars (range: 1.7 to 4.7) show these attitudes for the years 1985, 1990, 1996, 2006, and 2016. The right-most bars thus equals the values of . Source: ISSP.
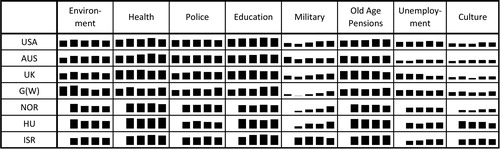
TABLE 3 ROG 2016. Attitudes Toward Government Spending (means)Table Footnote*
FIGURE 4 Attitudes toward government responsibility over time.*
*See for the coding of depicted variables. Bars show these attitudes for the years 1985, 1990, 1996, 2006, and 2016. The right-most bars thus equals the values of . Source: ISSP.
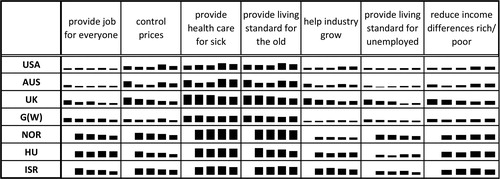
TABLE 4 ROG 2016. Attitudes Toward Government Responsibility (in %)Table Footnote*