Figures & data
Figure 1. Scale of environmental political participation (EPP), ranging from individual and non-confrontational (left) to collective and confrontational (right) forms.
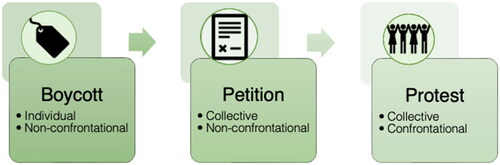
Figure 2. Model of how gender equality (gendered opportunity structures) can enable women’s EPP.
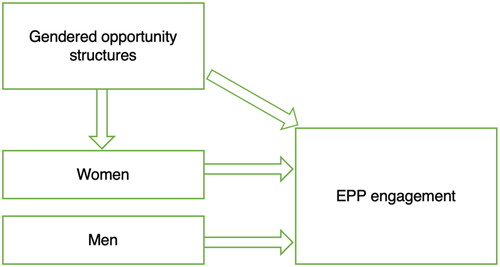
Table 1. Dependent variables.
Table 2. Independent variables.
Figure 3. Distribution of environmental political participation forms by gender.
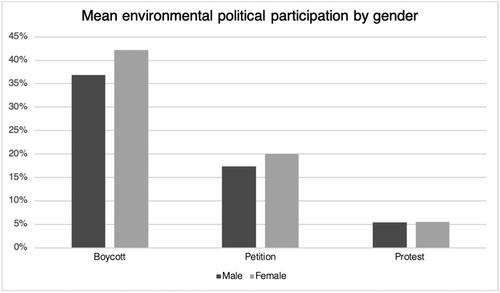
Table 3. Multilevel mixed-effects logistic regression: Protest.
Table 4. Multilevel mixed-effects logistic regression: Petition.
Table 5. Multilevel mixed-effects logistic regression: Boycott.
Figure 4. Predicted probability of Boycott: Interaction between gender and economic gender equality. Covariates include age and education level.
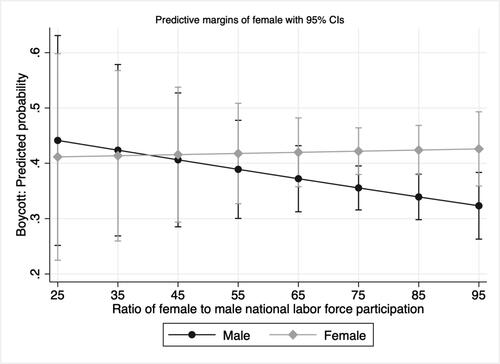
Figure 5. Predicted probability of Boycott: Interaction between gender and political gender equality. Covariates include age and education level
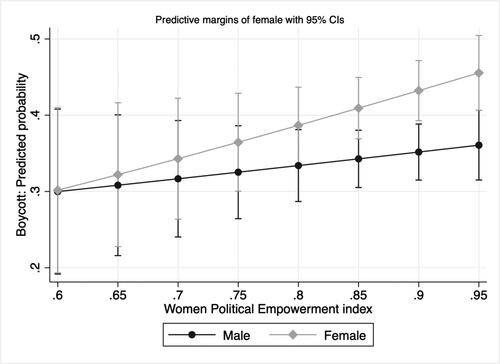
Figure 6. Predicted probability of Boycott: Interaction between gender and GDP. Covariates include age and education level.
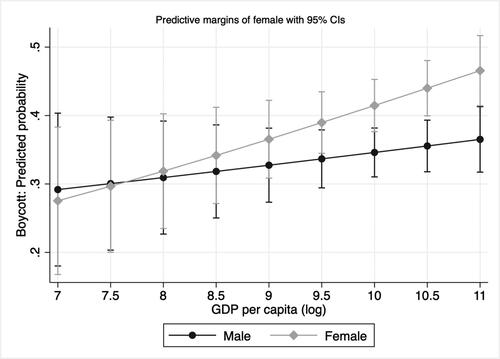
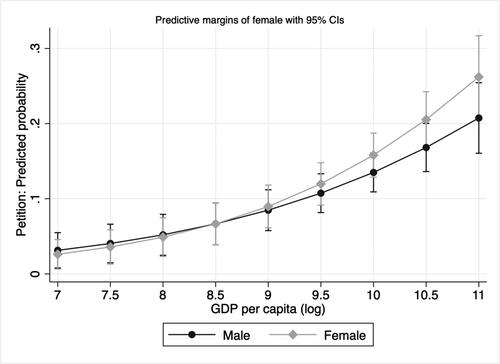
Figure 7. Predicted probability of Petition: Interaction between gender and political gender equality. Covariates include age and education level.
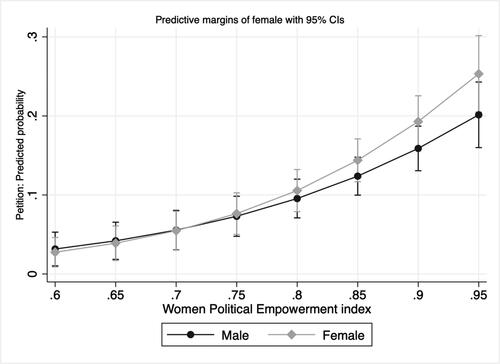
Figure 8. Predicted probability of Petition: Interaction between gender and GDP. Covariates include age and education level.