Figures & data
Table 1. Components of sample 1.
Table 2. Components of sample 2.
Table 3. Components of sample 3.
Table 4. Components of sample 4.
Table 5. Components of sample 5.
Table 6. Components of sample 6.
Figure 1. Representative temperature profiles of PTFE surface during heat-assisted plasma treatment for 600 s at 18.7 W/cm2 three times.
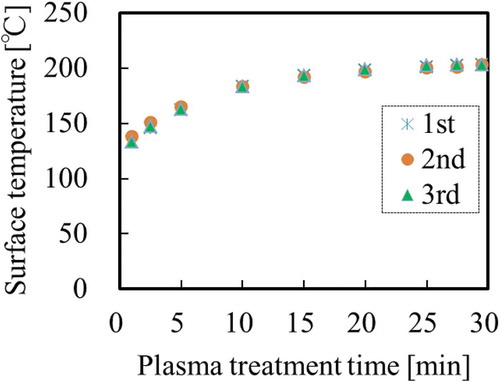
Figure 2. Representative C1s-XPS spectra of PTFE samples (a) before and (b) after heat-assisted plasma treatment for 600 s at 18.7 W/cm2.
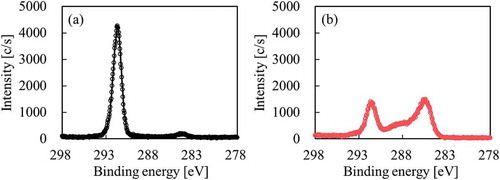
Figure 3. Representative ESR spectra of PTFE samples (a) before and (b) after heat-assisted plasma treatment for 600 s at 18.7 W/cm2.
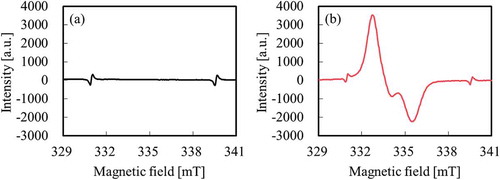
Figure 4. Schematic diagram of the sample preparation sequence for the adhesion test.
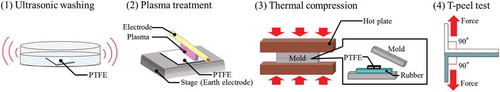
Figure 5. Results of the vulcanisation judgement test for confirmation of proper vulcanisation time. (a) Sample 1 at 180°C, (b) sample 2 at 170°C, (c) Sample 3 at 160°C, (d) Sample 4 at 150°C, (e) Sample 5 at 180°C, and (f) Sample 6 at 160°C.
Figure 6. Adhesion strength between the heat-assisted plasma-treated PTFE and rubber for samples 1–6 prepared as shown in –. no adhesives were used. * indicates that cohesion failure of rubber occurred in the middle of a T-peel test.
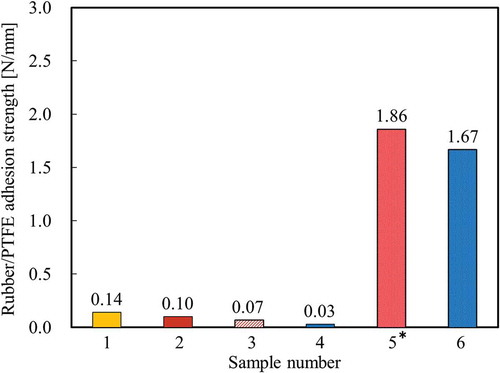
Figure 7. Photographs of samples 1–6 after T-peel test. (a) sample 1, (b) sample 2, (c) sample 3, (d) sample 4, (e) sample 5, and (f) sample 6. * indicates that cohesion failure of rubber occurred in the middle of a T-peel test.
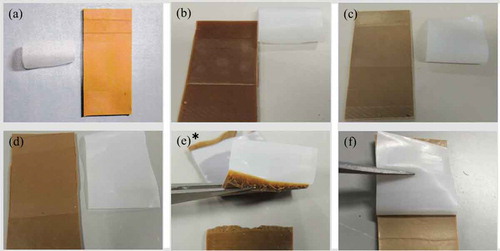
Table 7. Components of NR with different amounts of SiO2.
Figure 8. Adhesion strength between the heat-assisted plasma-treated PTFE and NR samples prepared with different amounts of SiO2 as shown in . * indicates that cohesion failure of rubber occurred in the middle of a T-peel test.
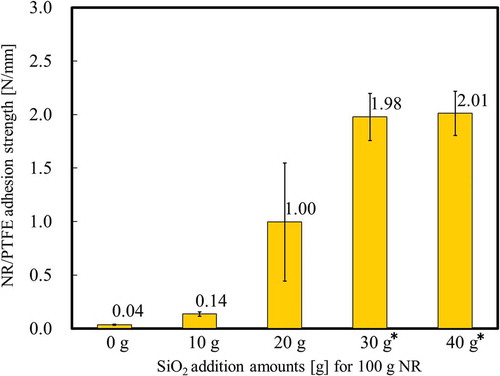
Figure 9. Schematic diagram of the sequence for confirming the reaction between plasma-treated PTFE and SiO2 powder using XPS. (a) before thermal compression, (b) after thermal compression. *1 Thermal compression was performed at almost 10 MPa at 180°C for 10 min. *2 Heat-assisted plasma treatment was performed for 600 s at 18.7 W/cm2. *3 Three types of SiO2 powders: VN3, H18, and N20 were used. *4 A vulcanised rubber having high heat-resistance was used as a cushion.
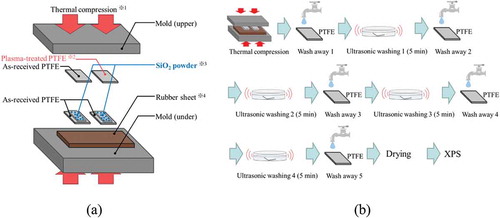
Figure 10. XPS spectra of the PTFE surface after thermal-compression with hydrophilic SiO2 powder (VN3) (a) C1s, (b) Si2p.
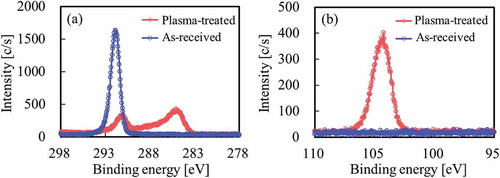
Figure 11. XPS spectra of the PTFE surface after thermal-compression with hydrophobic SiO2 powder (H18) (a) C1s, (b) Si2p.
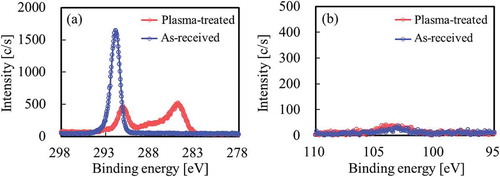
Figure 12. XPS spectra of the PTFE surface after thermal-compression with hydrophilic SiO2 powder (N20) (a) C1s, (b) Si2p.
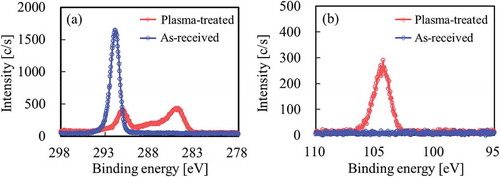
Table 8. Atomic ratios of the PTFE surface after thermal compression with SiO2 powder, which calculated from each survey XPS spectrum.
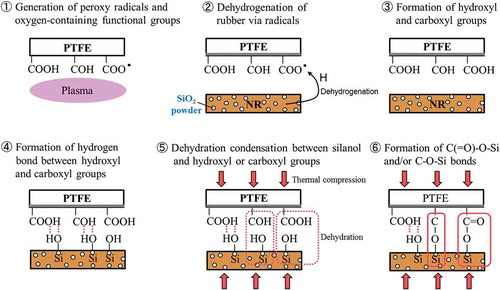
Figure 13. Proposed model for strong adhesion between heat-assisted plasma-treated PTFE and rubber containing SiO2 powder.