Figures & data
Table 1. Mechanical and fracture properties of the adhesives Araldite® AV138,[Citation32] Araldite® 2015,[Citation21] and Sikaforce® 7752.[Citation22].
Figure 1. Geometries of the flat SLJ for the CZM validation process (a) and curved JLJ for the CZM parametric analysis (b).
Figure 2. Boundary conditions and loads applied to the joints, with details at the model supports (a) and overlap (b).
Table 2. CFRP interlaminar and adhesive layer CZM properties.
Figure 3. Experimental cohesive failure in the adhesive layer for the adhesive Araldite® AV138 and LO = 10 mm (a), experimental interlaminar failure in the CFRP for the adhesive Araldite® AV138 and LO = 40 mm (b) and respective CZM prediction (c), experimental cohesive failure in the adhesive layer for the adhesive Araldite® 2015 and LO = 20 mm (d) and respective CZM prediction (e).
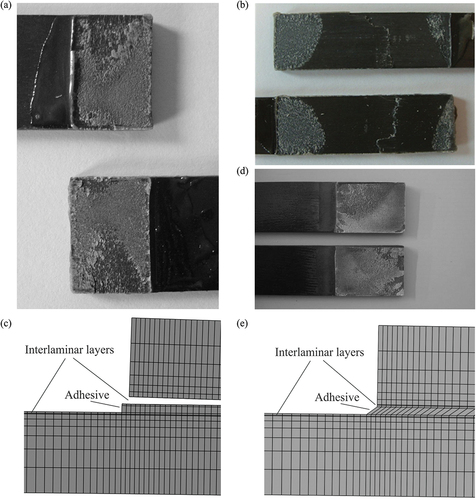
Figure 4. Experimental/numerical P-δ curve comparison: example for the joints bonded with the adhesive Araldite® 2015 and LO = 10 mm.
Figure 5. Experimental/numerical Pm vs. LO evolution for the joints bonded with the adhesive Araldite® AV138 (a) and 2015 (b), including the standard deviation of the experimental data.
Figure 6. σy/τavg (a) and τxy/τavg (b) stresses for the 2015 considering fixed R = 1000 m and varying LO (10 and 80 mm) and tP (1.2 and 3.6 mm).
Figure 7. Peak σy/τavg (a) and τxy/τavg (b) stresses for the 2015 at x/LO = 0 and x/LO = 1 considering fixed LO = 10 mm, tP = 1.2 mm and R = 1000 m, and varying R (1000, 2000 and 3000 mm).
Figure 8. Numerical predictions of cohesive failure in the adhesive layer of a joint bonded with the adhesive Araldite® 2015, R = 1000 mm, LO = 10 mm and tp = 1.2 mm (a) and interlaminar failure in the CFRP of a joint bonded with the adhesive Araldite® 2015, R = 1000 mm, LO = 10 mm and tp = 2.4 mm (b).
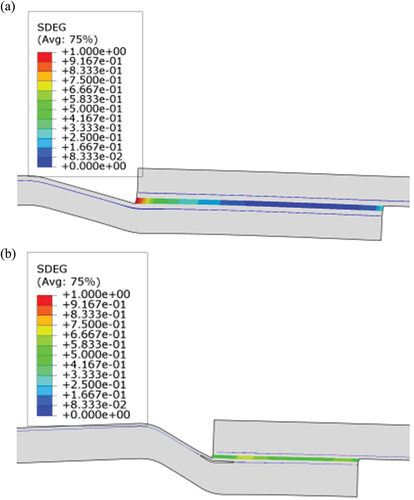
Figure 9. Failure plot of the joints bonded with the adhesive Sikaforce® 7752 per tP and LO (dimensions in mm).
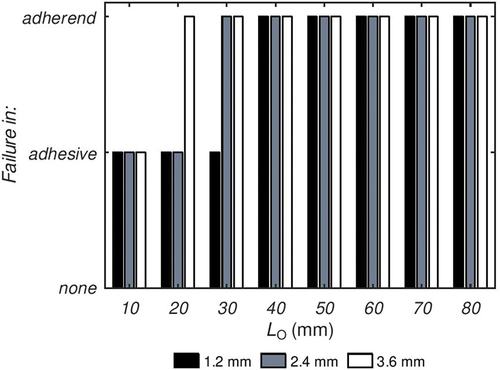
Figure 10. Pm vs. LO comparison between the three adhesives for tP = 1.2 mm (a), 2.4 mm (b), and 3.6 mm (c), considering fixed R = 1000 mm.
Figure 11. Pm vs. LO comparison for different R, considering fixed adhesive (2015) and tP = 1.2 mm.
Figure 12. U vs. LO comparison between the three adhesives for tP = 1.2 mm (a), 2.4 mm (b), and 3.6 mm (c), considering fixed R = 1000 mm.
Figure 13. U vs. LO comparison for different R, considering fixed adhesive (2015) and tP = 1.2 mm.