Figures & data
Figure 1. Colony loss rates (%) of Apis mellifera honey bee colonies in the United States. Panes specify losses for (A) all operation types; (B) backyard beekeepers (1–50 colonies); (C) sideline beekeepers (51–500 colonies); and (D) commercial beekeepers (>500 colonies). The points represent the percentage of colonies lost, and the shaded bands and error bars represent the bootstrapped 95% confidence intervals (n-out-of-n, 1000 rep). Yellow, blue, and red represent summer, winter, and annual seasons, respectively. The survey year on the figure denotes the year the survey was conducted. For example, the 2022 survey year includes data for the summer of 2021 and the winter of 2021–22. Data for 2008–2020 are from previous surveys.
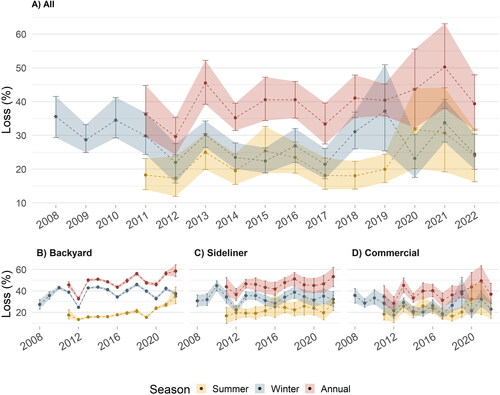
Table 1. Colony loss rates (%) of Apis mellifera honey bee colonies in the United States for 2020–21 and 2021–22.
Figure 2. Colony loss rates (%) of Apis mellifera honey bee colonies in U.S. states and territories in 2020–21 and 2021–22. Orange and green colors represent loss rates above and below 30%, respectively. The grey color indicates that results are redacted for those states that had fewer than 10 respondents during a season. The survey year on the figure denotes the year the survey was conducted. For example, the 2022 survey year includes data for the summer of 2021 and the winter of 2021–22. MSO: multi-state operation; NCU: non-continental U.S. (Guam, Hawaii, Puerto Rico, and the U.S. Virgin Islands). Multi-state operations were counted in each state that they reported owning colonies but were also reported as a separate subgroup.
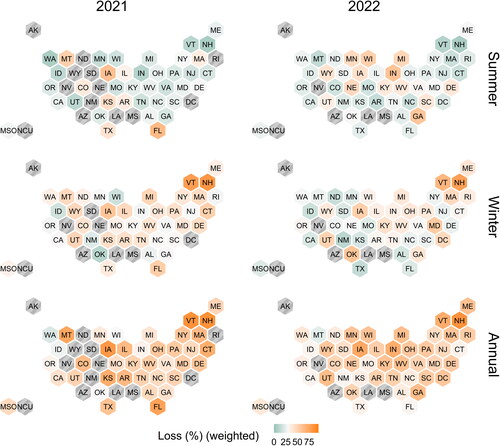
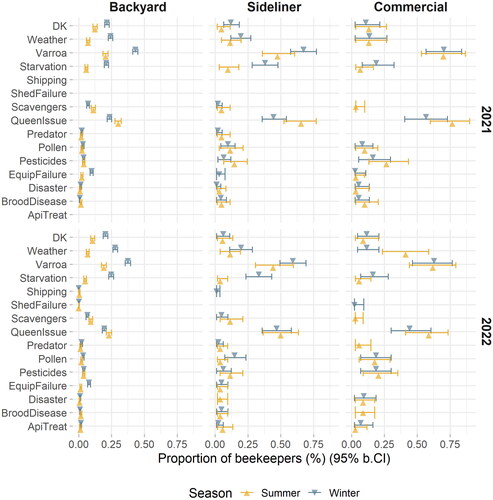
Figure 3. Causes of Apis mellifera honey bee colony loss as reported by United States beekeepers in 2020–21 and 2021–22. The graph shows the proportion of beekeepers who identified each cause of loss as being in the top three causes of loss for their operation. Operation types are backyard beekeepers (1–50 colonies), sideline beekeepers (51–500 colonies), and commercial beekeepers (>500 colonies). Causes of loss are reported separately for the summer (yellow) and winter (blue) seasons. The points represent the numerical proportion of beekeepers reporting the cause of loss, and the error bars represent bootstrapped 95% confidence intervals (n-out-of-n, 1000 rep). ApiTreat: “Apicultural treatments”; Disaster: “Natural disaster”; EquipFailure: “Equipment failure (e.g., moisture, ventilation); Pollen: “Nutritional stress (pollen deprivation); QueenIssue: “Queen issues”; Scavengers: “Scavenger pests”; Weather: “Adverse weather”; ShedFailure: “Failure of environmental controls in sheds (wintering facilities)”; DK: “Don’t know.”