Figures & data
Figure 1. Reflectance spectra of the matt black paper used under the leaf samples (black, solid line), 100% reflection standard (red, long-dashed line) and a Vantablack surface (green, dashed line). Specular reflectance was measured with an STS-VIS spectrometer, using a 250 W halogen lamp as a light source. For the measurement, the probe was placed 7 mm above the surface and aligned with the surface normal. Each curve represents an average of 10 technical replicates, and the data have been smoothened with a moving median.
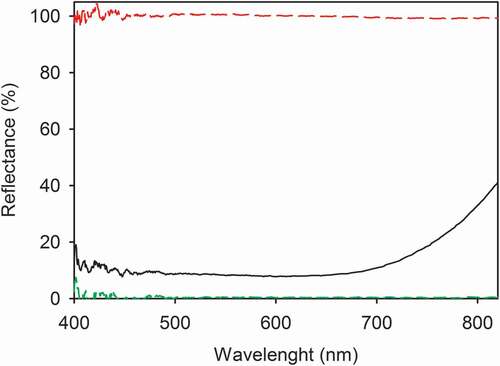
Figure 2. Reflectance spectra of green (black, solid line) and yellow (red, dashed line) leaves of B. pendula (a) and examples of the leaves (b). Specular reflectance was measured with an STS-VIS spectrometer, using a 250 W halogen lamp as a light source. For the measurement, a leaf disk was placed on a matt black cardboard at a 5 mm distance from the probe, and the probe was aligned with the surface normal. Each curve represents an average of 6 independent biological replicates, and the data have been smoothened with a moving median using a window of 9 data points.
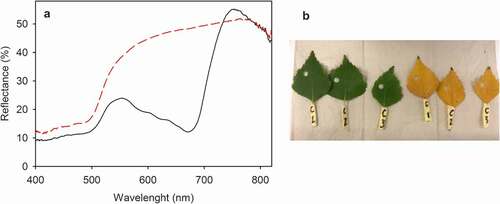
Table 1. Pigment composition of leaves of H. vulgare and E. pulcherrima. Pigments were measured from samples similar to those used for the reflectance measurements and quantified spectrophotometrically according to Wellburn (Citation1994). The dash indicates that no quantitative extraction was done.
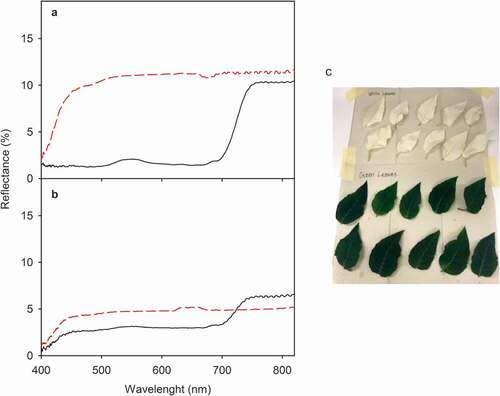
Figure 3. Reflectance spectra of green (black, solid line) and white (red, dashed line) of Hordeum vulgare cv. variegata leaves (a) and examples of the measured leaves (b). Specular reflectance was measured with an STS-VIS spectrometer, using a 250 W halogen lamp as a light source. For the measurement, a leaf disk was placed on a matt black cardboard at a 5 mm distance from the probe, and the probe was aligned with the surface normal. Each curve represents an average of 10 independent biological replicates, and the data have been smoothened with a moving median using a window of 9 data points.
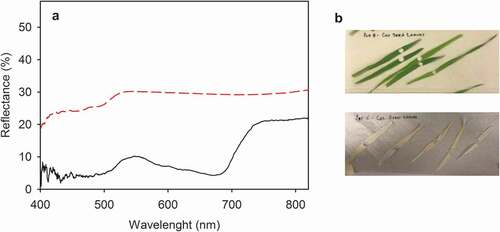
Figure 4. Reflectance spectra of green (black, solid lines) and white (red, dashed lines) of E. pulcherrima leaves placed on white (a) or black (b) background; the measured samples are also shown (c). Specular reflectance was measured with an STS-VIS spectrometer, using a 250 W halogen lamp as a light source. For the measurement, a leaf disk was placed on white copy paper (a) or on a matt black cardboard (b) at a 5 mm distance from the probe, and the probe was aligned with the surface normal. Each curve represents an average of 10 independent biological replicates, and the data have been smoothened with a moving median using a window of 9 data points.