Figures & data
Figure 1. Detailed structure of the microstructured cover flow mixer for ZnO nanoparticles synthesis. (a) Overall structure. (b) Top view of the first cyclone plate. (c) Top view of the second cyclone plate. (d) Cross-sectional view along the green line in (b) of the first cyclone mixer. (e) Cross-sectional view along the green line in (c) of the second cyclone. (f) Channel structure. (g) Streamline image.
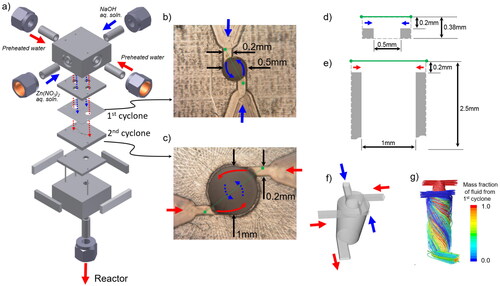
Figure 2. Schematic diagram of the experimental apparatus for continuous hydrothermal synthesis.
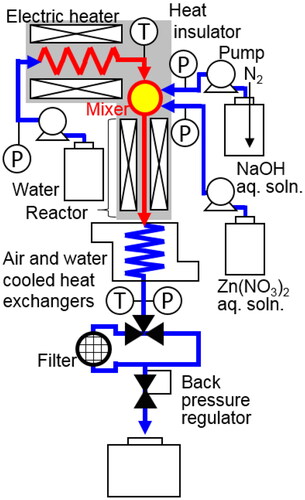
Figure 3. Views of the mixers. (a) Cover flow mixer. (b) Tee mixer (0.3 mm i.d.). (c) Tee mixer (1.3 mm i.d.). (d) Tee mixer (2.3 mm i.d.). (e) Cross mixer (1.3 mm i.d.). (f) Central collision micromixer (0.3 mm i.d.).
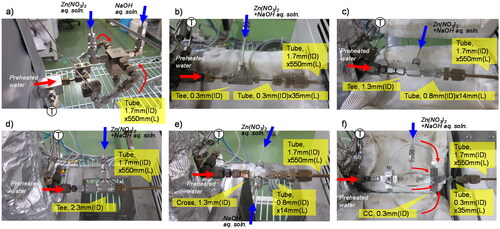
Figure 4. XRD patterns of the products were synthesized using the cover flow mixer at a flow rate of 75 g/min and a Zn(NO3)2 molality of 0.20.
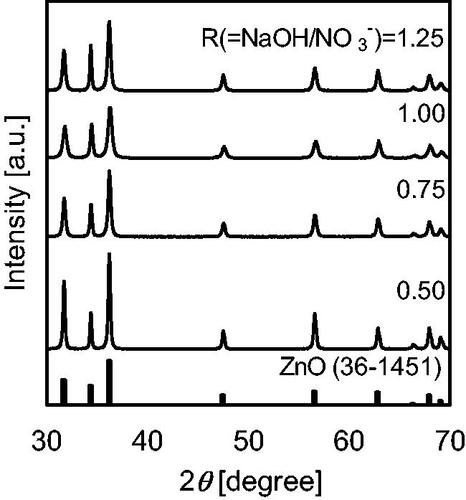
Figure 5. TEM images of the products were synthesized using the cover flow mixer at a flow rate of 75 g/min and a Zn(NO3)2 molality of 0.20.
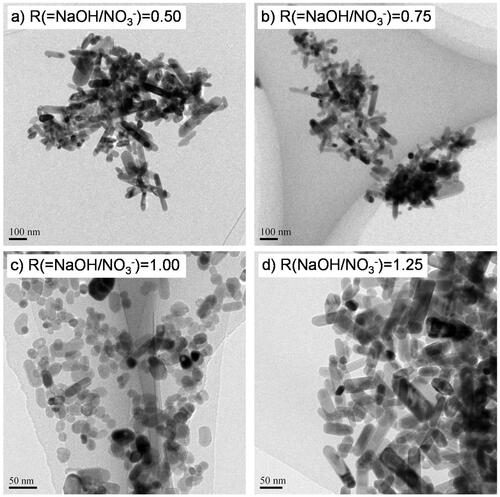
Figure 6. Variation in APS with R(=NaOH/NO3−) evaluated by (a) TEM, (b) XRD, and (c) BET surface area analysis. The dashed lines illustrate the trend.
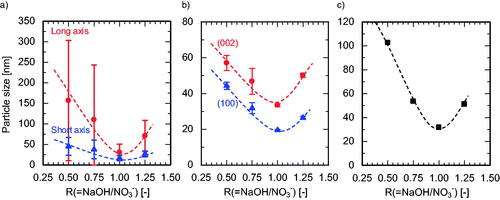
Table 1. Summary of experiments on continuous hydrothermal synthesis of ZnO nanoparticles.
Figure 7. Variation in APS with flow rate at different Zn(NO3)2 molarities evaluated by (a) TEM, and (b) XRD analyses.
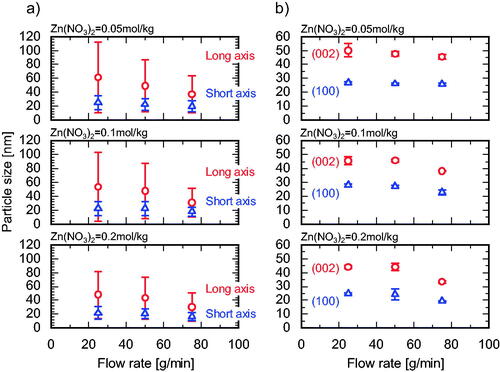
Figure 8. Particle size distributions (1) long axis, (2) short axis of the products synthesized using a Zn(NO3)2 molality of 0.20 in a (a) cover flow micromixer (75 g/min), (b) cover flow mixer (25 g/min), (c) tee mixer (0.3 mm i.d., 75 g/min), (d) tee mixer (1.3 mm i.d., 75 g/min), (e) tee mixer (2.3 mm i.d., 75 g/min), (f) cross mixer (1.3 mm i.d., 75 g/min), and (g) central collision micromixer (0.3 mm i.d., 75 g/min).
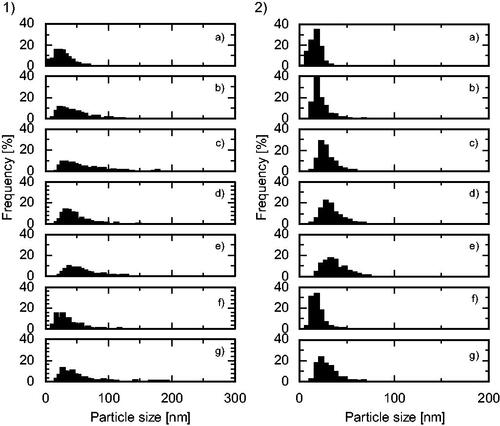
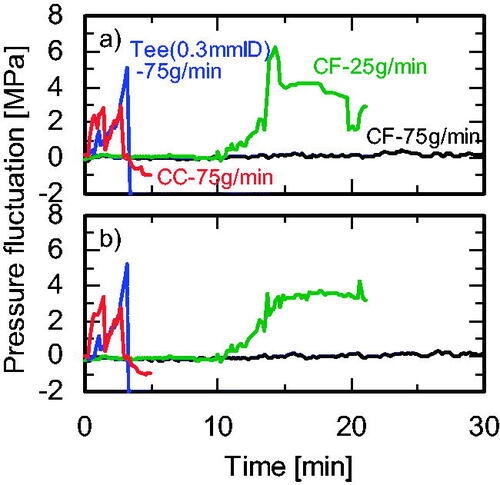
Figure 9. Variation of pressure fluctuation in the (a) water and (b) Zn(NO3)2 channels with time during the experiment using different mixers.