Figures & data
Figure 1. An Institutional Representation of the Money Creation Process.
Source: Author.
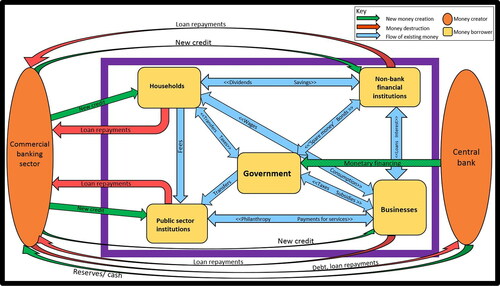
Figure 2. UK Money Supply, 1950–2021: Broad Money (M4) and Base Money (M0).
Source: Federal Reserve. https://fred.stlouisfed.org/series/MBM0UKM
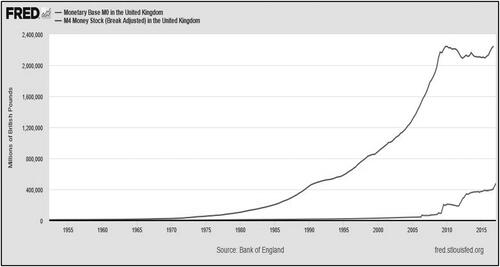
Figure 3. A Practical Illustration of How Money is Created as Debt.
Source: Author.
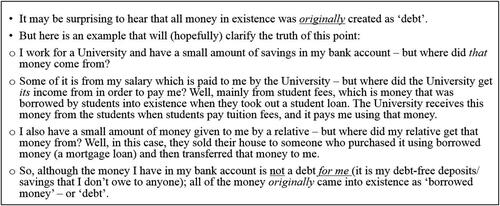
Figure 4. A Representation of the Relationship Between the Bankmoney and Central Bank Reserve Circuits.
Source: Adapted by Author from Ryan-Collins et al. (Citation2012).
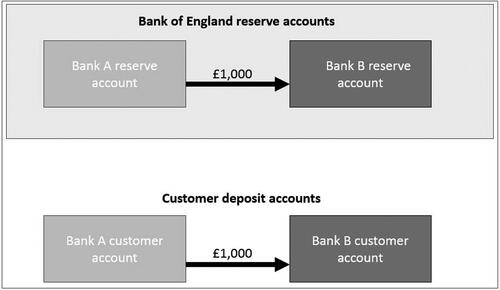
Figure 5. A Representation of the “Canceling Out” of Transfers of Money Between Different Banks.
Source: Adapted by Author from Ryan-Collins et al. (Citation2012).
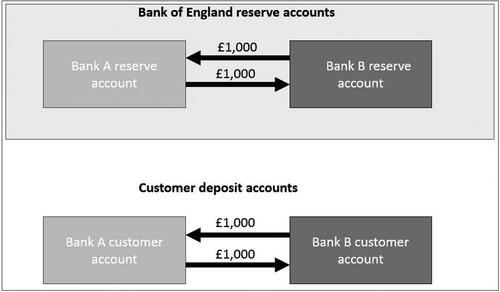
Figure 6. A Representation of the Interbank Clearing Process.
Source: Ryan-Collins et al. (Citation2012).
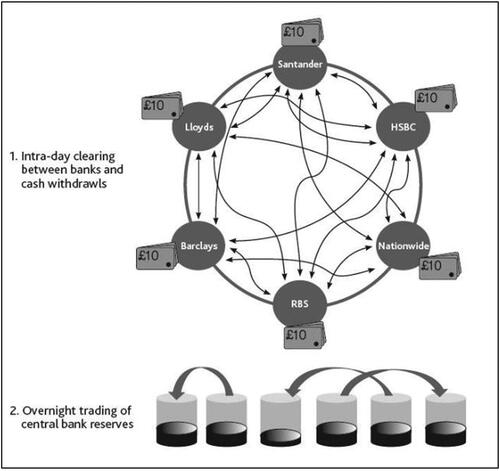
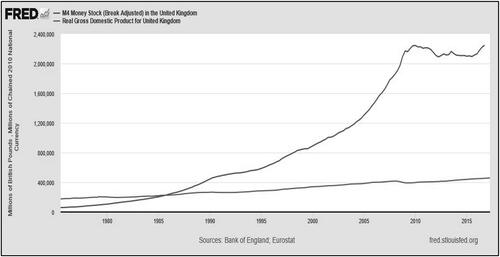
Figure 7. Broad Money (M4) and GDP in the UK, 1970–2021. Source: Federal Reserve. https://fred.stlouisfed.org/series/MBM0UKM