Figures & data
Figure 1. Screenshot of the profit maximization with no market simulation.
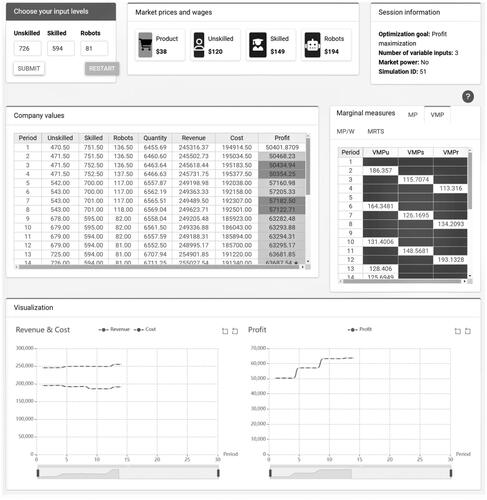
Table 1. Profit maximization with no market power (simulation ID: 51).
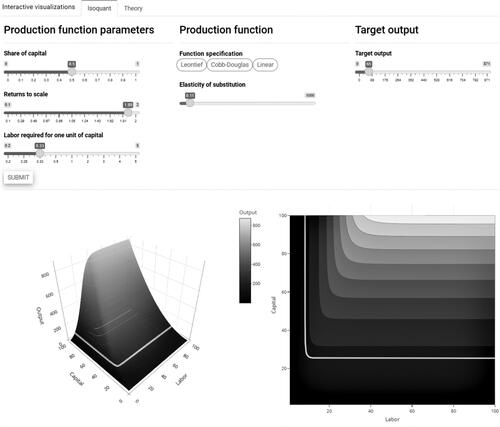
Figure 2. Screenshot of isoquant curve in the profit-maximization visualization.
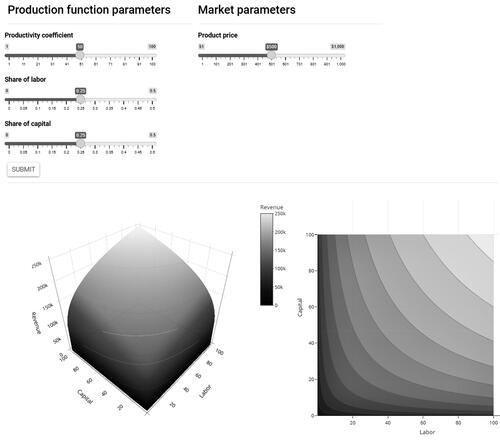
Figure 3. Screenshot of isocost curve in the profit-maximization visualization.
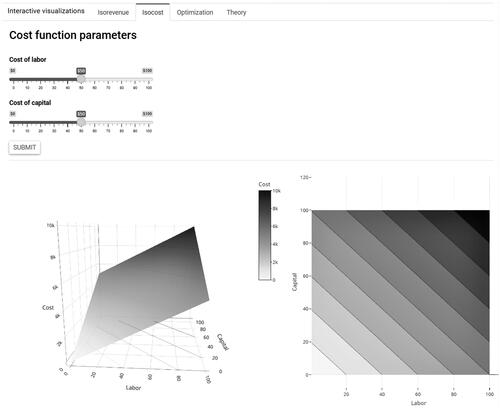
Figure 4. Screenshot of optimization tab in the profit-maximization visualization.
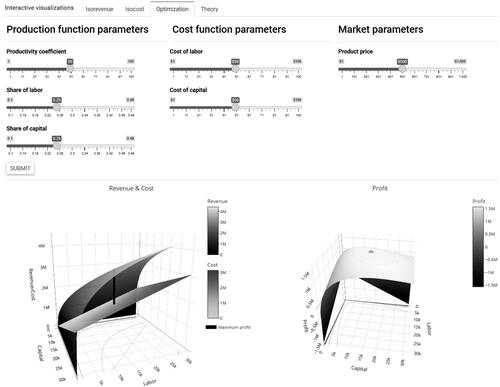
Figure 5. Screenshot of isoquant curve in the cost minimization visualization.
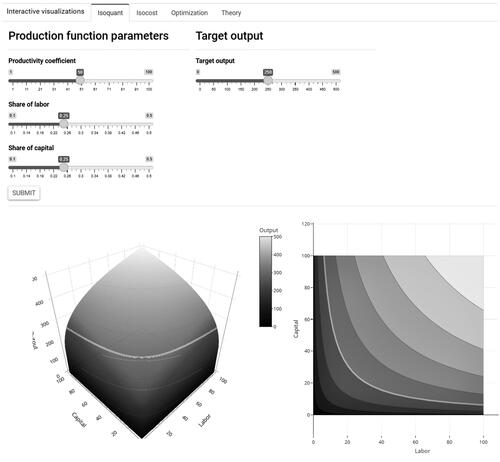
Figure 6. Screenshot of isocost curve in the cost minimization visualization.
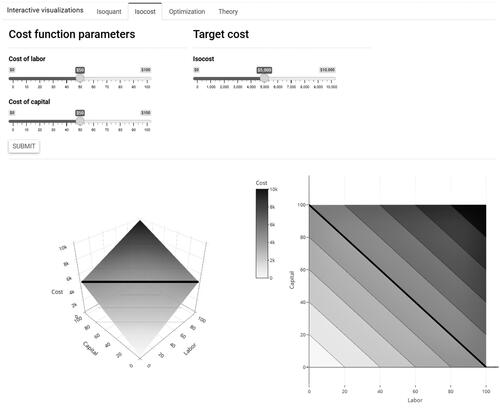
Figure 7. Screenshot of optimization tab in the cost minimization visualization.
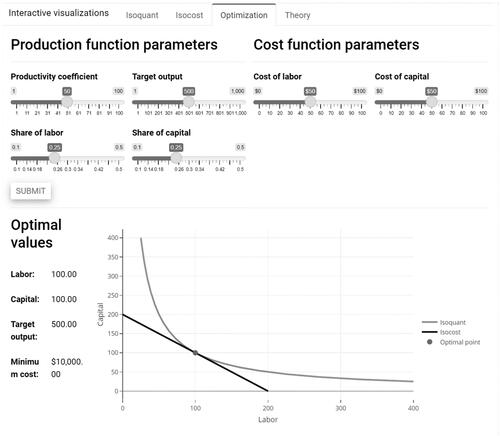
Figure 8. Screenshot of the isoquant tab in the production function visualization.