Figures & data
Table 1. Descriptive statistics on the study variables.
Table 2. Correlations of the study variables.
Table 3. Hierarchical regression models for predicting the gain score with cognitive variables.
Table 4. Hierarchical regression models for predicting the gain score with math-related emotions and beliefs.
Figure 1. Profiles of the cognitive predictive variables of the response and no-response Groups by gender.
Distribution information of each cognitive predictive variables for non-responding and responding girls and boys covering minimum, median and maximum value as well as outliers.
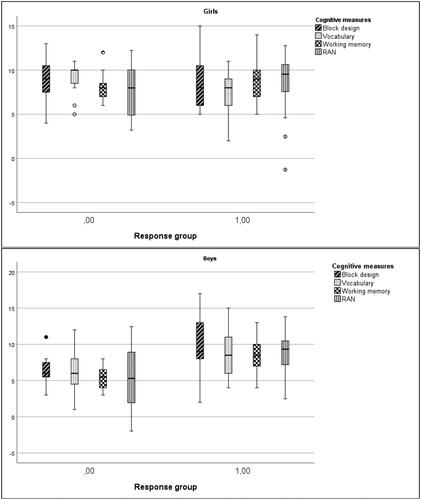
Figure 2. Profiles of the beliefs and emotions of the response and no-response groups by gender.
Distribution information of math-related emotions and beliefs for non-responding and responding girls and boys covering minimum, median and maximum value as well as outliers.
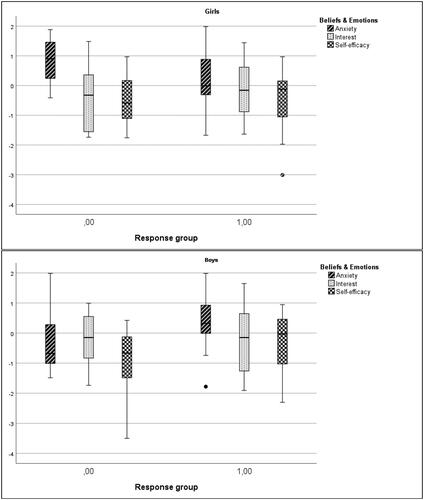
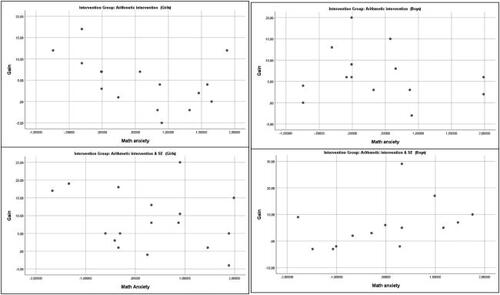
Figure A1. Scatterplots of relation between intervention gain and math anxiety presented separately for girls and boys and two intervention groups.