Figures & data
Figure 1 Aerated nappe profile for steady overflows
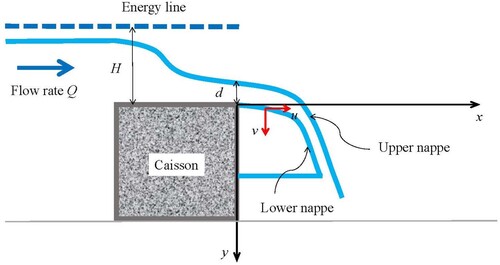
Figure 2 (a) Computational domain of the numerical wave model; (b) mesh detail
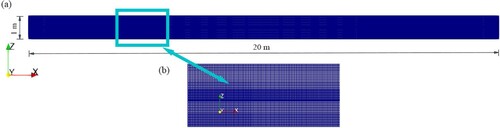
Figure 3 Sketch of the free overflow weirs. (a) experimental set-up, P1 is the pressure sensor to measure water pressure near the bottom; P2 is the pressure sensor to measure water pressure near the water surface; P3 is the pressure sensor to measure air pressure within the cavity; (b) calculation domain of the numerical model
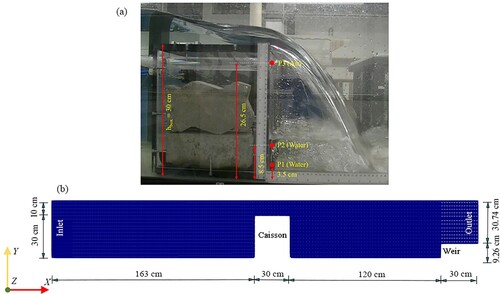
Figure 4 Time series of free surface elevation with respect to the bottom (z = 0 m) at downstream distances (a) x = 5 m; (b) x = 10 m; (c) x = 15 m; (d) x = 17 m
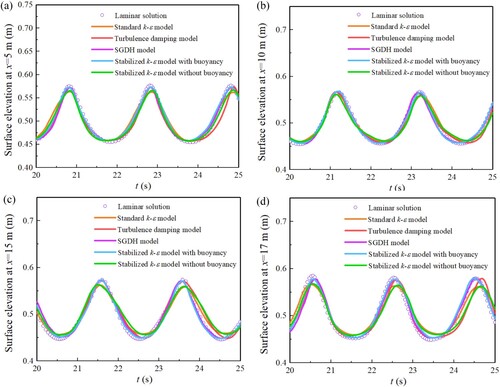
Table 1 Relative errors on wave surface elevation predictions using different turbulence models
Figure 5 Turbulent quantities at t = 25 s using different turbulence treatment methods (instantaneous results). (a) Phase volume fraction, alpha.water = 1 is water phase, alpha.water = 0 is air phase, 0 < alpha.water < 1 is mixed air and water; (b) TKE; (c) turbulence dissipation rate; (d) turbulent viscosity
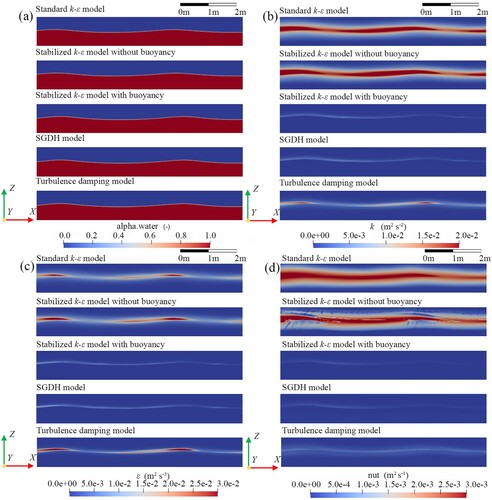
Figure 6 Turbulent kinematic viscosity at t = 25 s using the SGDH model and the stabilized k-ε model with buoyancy
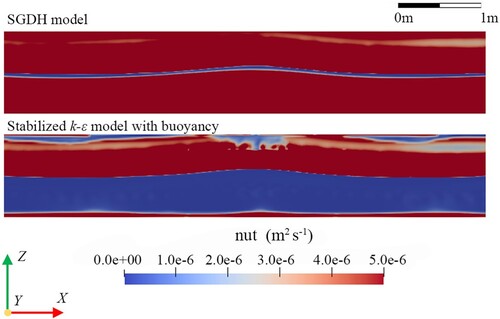
Figure 7 Turbulence quantities of fully-aerated nappe flow at t = 30 s using different turbulence treatment methods. (a) Phase volume fraction, alpha.water = 1 is water phase, alpha.water = 0 is air phase, 0 < alpha.water < 1 is mixing air and water; (b) TKE; (c) turbulence dissipation rate; (d) turbulence viscosity
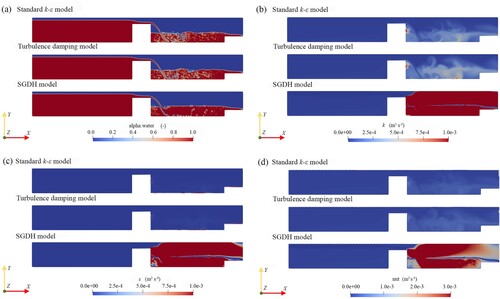
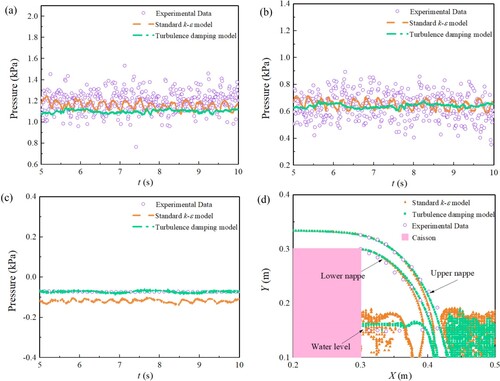
Figure 8 Comparison of pressure on the downstream face of the caisson and nappe trajectory using experimental data, ballistic model, the standard k-ε model, the turbulence dissipation model and the SGDH model for a fully-aerated nappe (a) bottom water pressure; (b) top water pressure; (c) air pressure; (d) nappe trajectory (the numerical data are instantaneous when the nappe trajectory is steady)
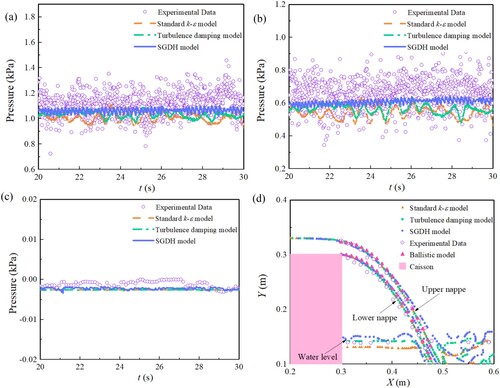
Figure 9 Turbulence quantities of the non-aerated nappe at t = 10 s using different turbulence treatment methods. (a) Phase volume fraction, alpha.water = 1 is water phase, alpha.water = 0 is air phase, 0 < alpha.water < 1 is mixing air and water; (b) TKE; (c) turbulence dissipation rate; (d) turbulence viscosity
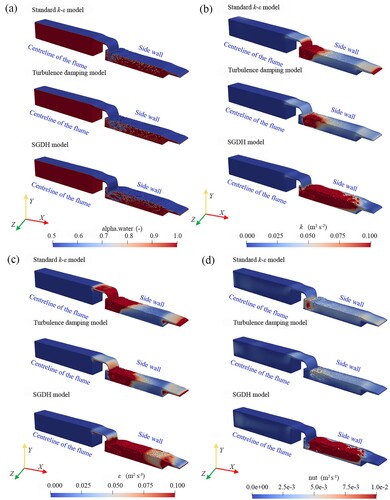
Figure 10 Comparison of pressure on the rear of the caisson surface and nappe trajectory using experimental data, ballistic model, the standard k-ε model, the turbulence dissipation model and the SGDH model for a non-aerated nappe (a) bottom water pressure sensor; (b) top water pressure sensor; (c) air pressure sensor; (d) nappe trajectory (the numerical data are instantaneous when the nappe trajectory is steady)