
Figures & data
Figure 1. Illustration of the experimental design. The sessions including active tapping as priming (A20, A60, A120, and A180) were counterbalanced. Besides, the sessions including passive tapping as priming (P20, P60, P120, and P180) were counterbalanced. In total, data from 28 and 29 participants in the active and passive group, respectively, were analyzed (for further details see the results section).
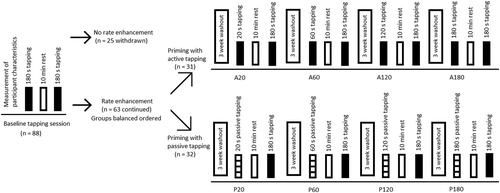
Figure 2. Representative recordings of individual taps from a single participant. Upper row: index finger displacement in the vertical direction (mm). Lower row: tapping force (N). Left column (A): active tapping. Right column (B): passive tapping. Each cycle was defined to begin when the tip of the finger was at its lowest point during each tap.
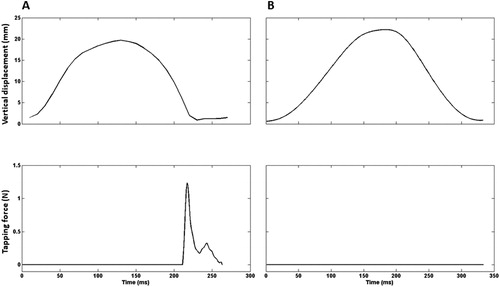
Figure 3. Average freely chosen tapping rates (± SD). The solid line represents data from the first bout in the baseline tapping session (BTS) and second bouts in the sessions, which included active tapping as priming (A20, A60, A120, and A180). The broken line represents data from the first bout in BTS and second bouts in sessions, which included passive tapping as priming (P20, P60, P120, and P180). *Different from the first bout in the BTS (p < 0.001). For clearness, SD bars are only shown in one direction.
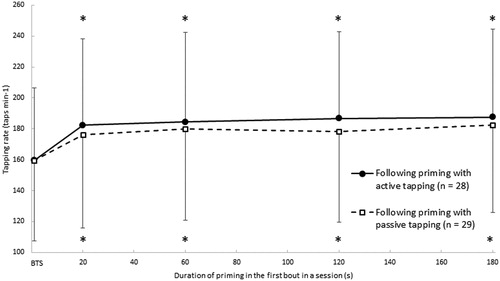
TABLE 1. Results of the two-way repeated measures mixed ANOVA of tapping rate, vertical displacement, peak force, time to peak force, and duration of finger contact phase. Bold text indicates statistical significance.
TABLE 2. Data for both groups of participants from the first bout in the baseline tapping session (BTS) and from the second bouts in sessions including active tapping as priming (A20, A60, A120, and A180) as well as in sessions including passive tapping as priming (P20, P60, P120, and P180). Values are presented as average ± SD.