Figures & data
Table 1. Typical characteristics of OPR1000 (Shin Kori units 1 and 2), CEOG PWR (Hanbit units 3 and 4), WOG PWR (Hanbit units 1 and 2), and Framatome PWR (Hanul units 1 and 2) at nominal operation.
Figure 1. Characteristics for two regimes of accident management.
Figure 2. MELCOR nodalization of OPR1000.
Figure 3. MELCOR nodalization for core.
Table 2. Summary of the simulation matrix.
Table 3. Probability of transition from initiating events to severe accidents for OPR1000.
Table 4. Severe accident mitiygation strategies of SAMG.
Figure 4. Flowchart of SAMG of OPR1000.
Table 5. Design value and steady-state conditions of OPR1000.
Figure 5. Core water level dependent on CET of base cases.
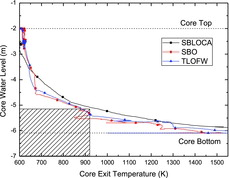
Table 6. Sequences of base cases.
Figure 6. RCS pressure of base cases.
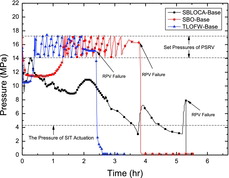
Figure 7. Two types of calculated time for RPV failure.
Table 7. Operator's available action time.
Table 8. Delayed RPV failure time by mitigation strategy.
Figure 8. Pressure behavior and cumulative water mass injected and ejected regarding RCS for SBLOCA-923K, the most delayed RPV failure time case.
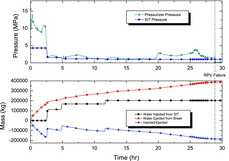
Figure 9. Pressure behavior and cumulative water mass injected and ejected regarding RCS for SBO-923K, the least delayed RPV failure time case.
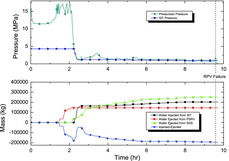
Figure 10. Pressure behavior and cumulative water mass injected and ejected regarding RCS for TLOFW-753 K, the most delayed RPV failure time case.
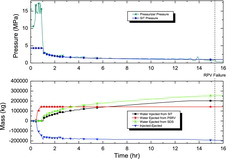
Figure 11. Delayed RPV failure time as a function of the average SIT injection rate.
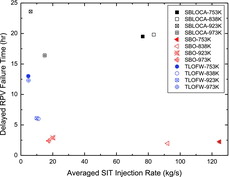
Figure 12. Amount of hydrogen generation for SBLOCA cases.
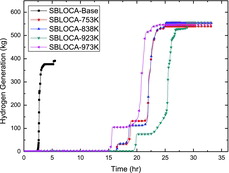
Figure 13. Amount of hydrogen generation for SBO cases.
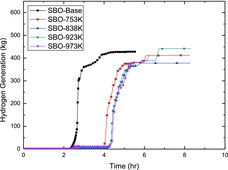
Figure 14. Amount of hydrogen generation for TLOFW cases.
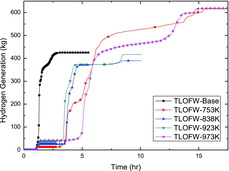
Figure 15. Hydrogen concentration of SBLOCA cases.
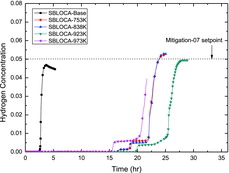
Figure 16. Hydrogen concentration of SBO cases.
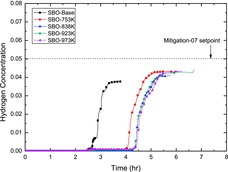
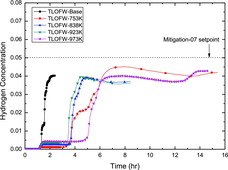
Figure 17. Hydrogen concentration of TLOFW cases.