Figures & data
Table 1. Values of OMP parameters.
Table 2. Coupled levels and deformation parameters.
Figure 1. Comparison of the present total cross section of natural Xe with the evaluated and experimental data.
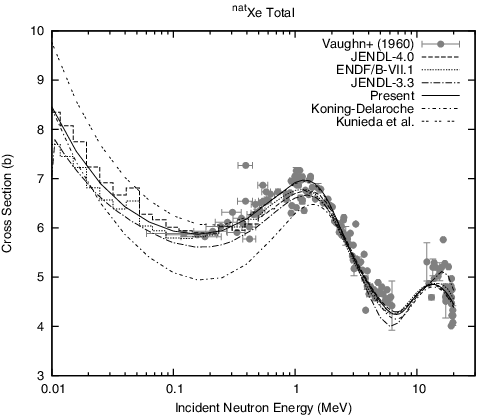
Table 3. Pre-equilibrium parameters.
Table 4. Level density parameters for each isotope.
Figure 2. Comparison of the present 124Xe(n,γ)125Xe reaction cross section with the evaluated and experimental data.
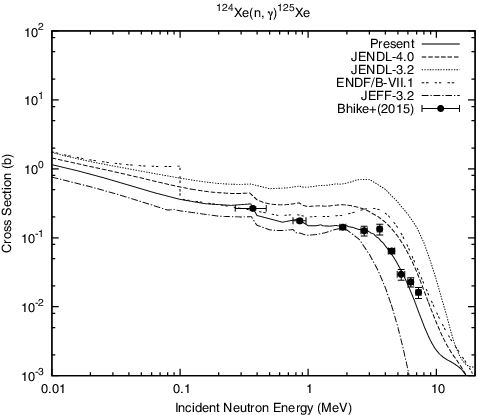
Figure 3. Comparison of the present 128Xe(n,γ)129Xe reaction cross section with the evaluated and experimental data.
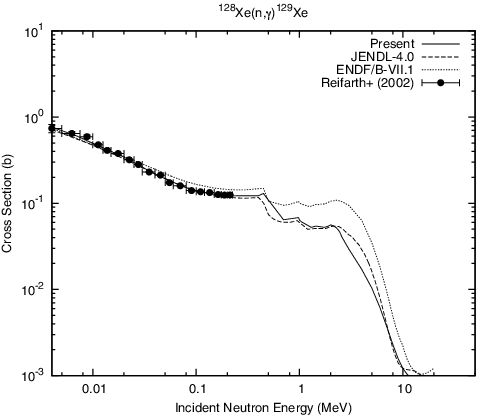
Figure 4. Comparison of the present 129Xe(n,γ)130Xe reaction cross section with the evaluated and experimental data.
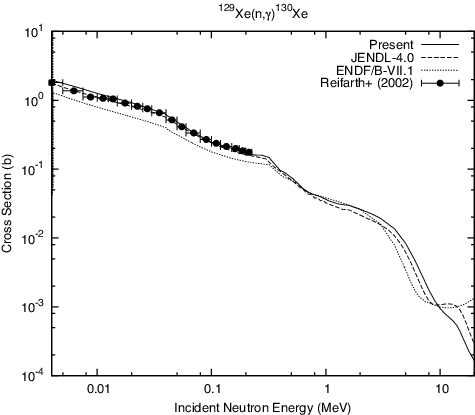
Figure 5. Comparison of the present 130Xe(n,γ)131Xe reaction cross section with the evaluated and experimental data.
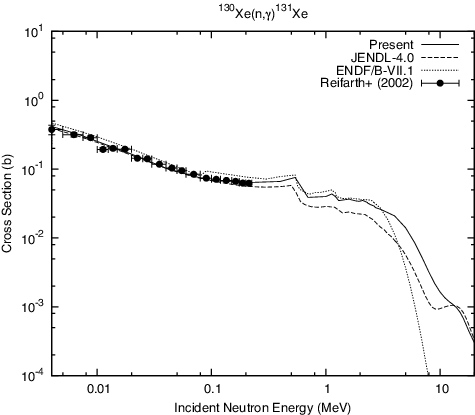
Figure 6. Comparison of the present 136Xe(n,γ)137Xe reaction cross section with the evaluated and experimental data.
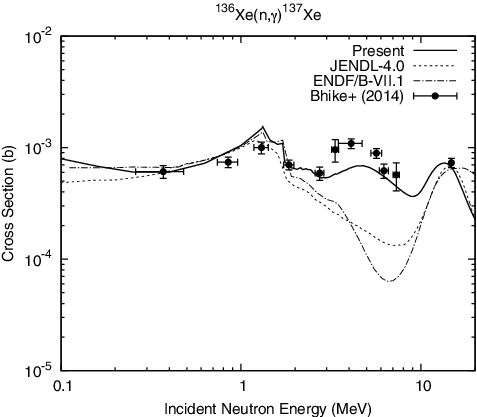
Figure 7. Comparison of the present capture cross sections of 126, 131, 132, 134Xe with the evaluated data.
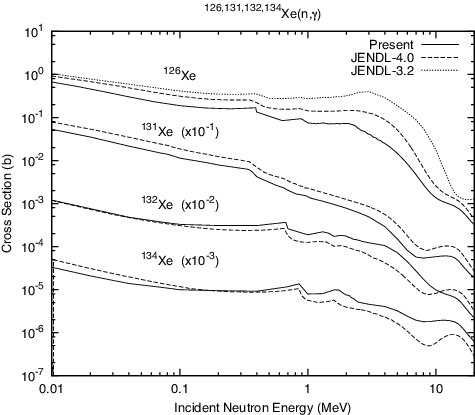
Figure 8. Comparison of the present 124Xe(n,2n)123Xe reaction cross section with the evaluated and experimental data.
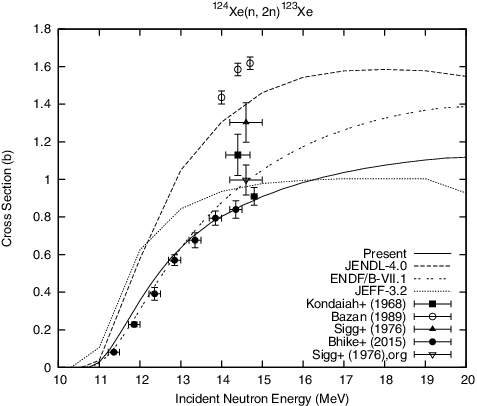
Figure 9. Comparison of the present 126Xe(n,2n)125Xe reaction cross section with the evaluated and experimental data.
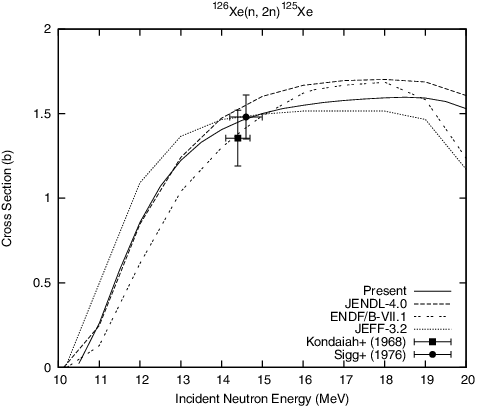
Figure 10. Comparison of the present 128Xe(n,2n)127Xe reaction cross section with the evaluated and experimental data.
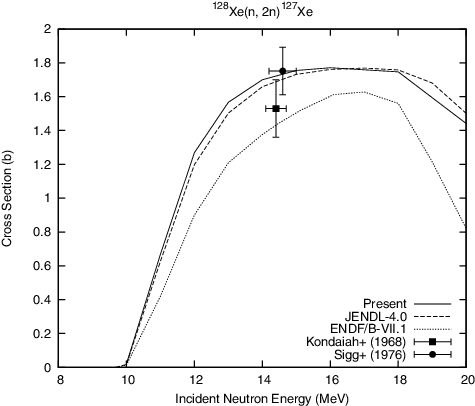
Figure 11. Comparison of the present 134Xe(n,2n)133Xe reaction cross section with the evaluated and experimental data.
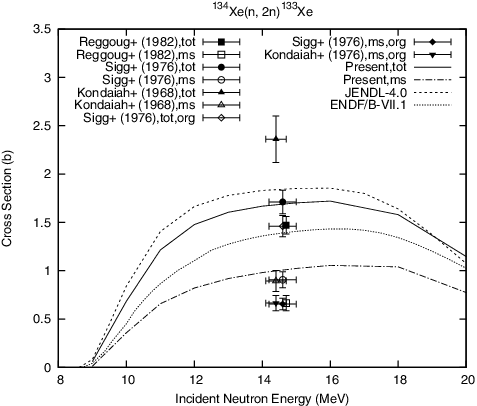
Figure 12. Comparison of the present 136Xe(n,2n)135Xe reaction cross section with the evaluated and experimental data.
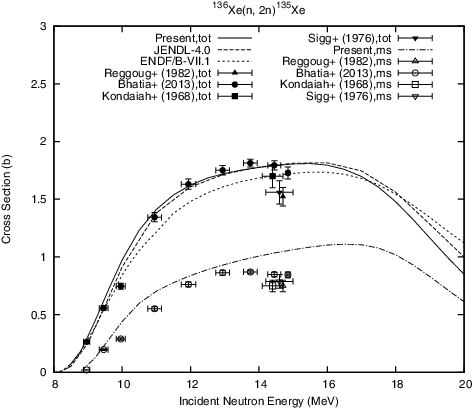
Figure 13. Comparison of the present 128Xe(n,p)128I reaction cross section with the evaluated and experimental data.
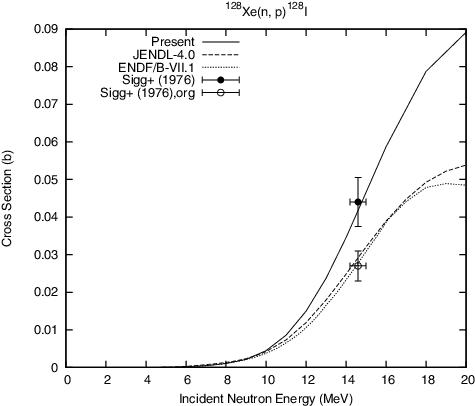
Figure 14. Comparison of the present 131Xe(n,p)131I reaction cross section with the evaluated and experimental data.
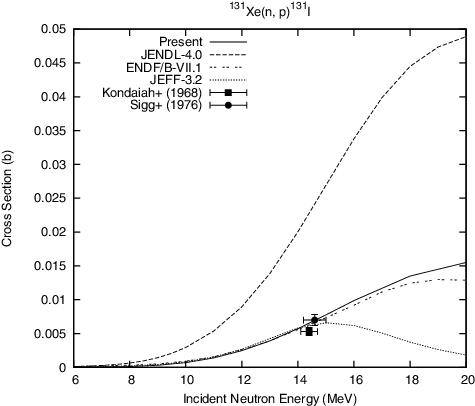
Figure 15. Comparison of the present natXe(n,α) reaction cross section with the evaluated and experimental data.
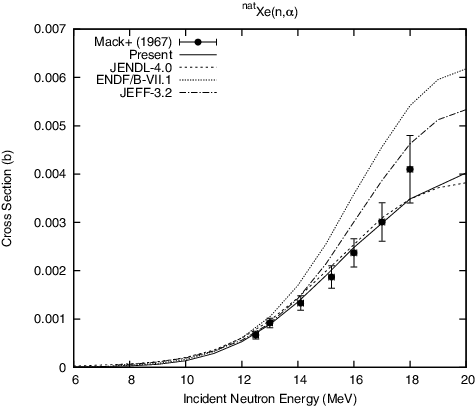
Figure 16. Comparison of the present elastic scattering angular distributions with the evaluated data for natural Xe.
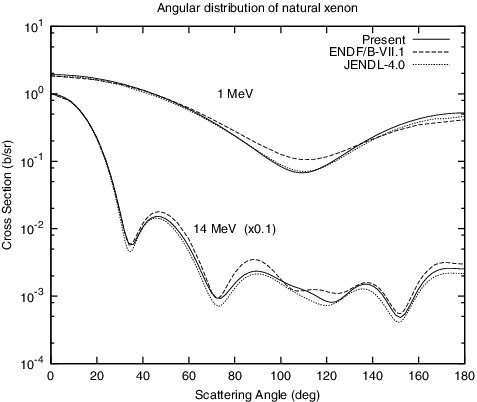
Figure 17. Comparison of the present neutron production double differential cross sections with those of JENDL-4.0 for natural Xe at emission angle 60 deg.
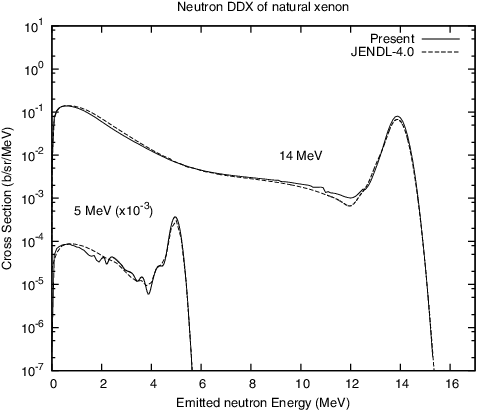
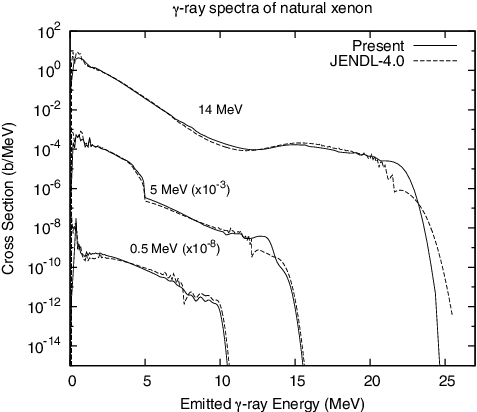
Figure 18. Comparison of the present γ-ray emission spectra with those of JENDL-4.0 for natural Xe.