Figures & data
Figure 1. AP1000 loop layout.
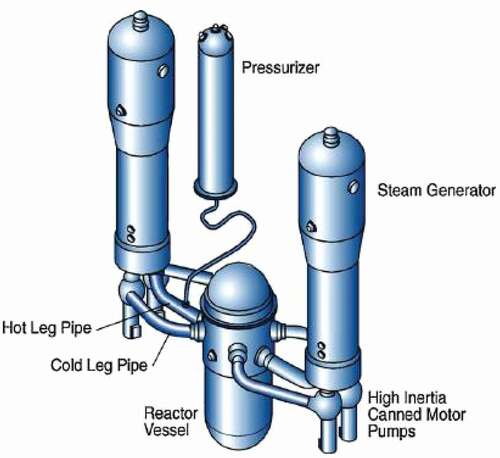
Figure 2. Geometric parameters of AP1000 RV outer profile, mm.
Figure 3. Views of the calculation domain mesh.
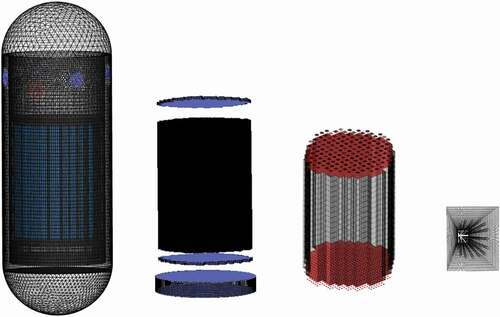
Table 1. Constants value in k-ε model
Table 2. Physical property parameter and boundary condition
Figure 4. Flow distribution on reactor vertical section. (a) Velocity distribution, m/s (b) Ttmperature distribution, K.
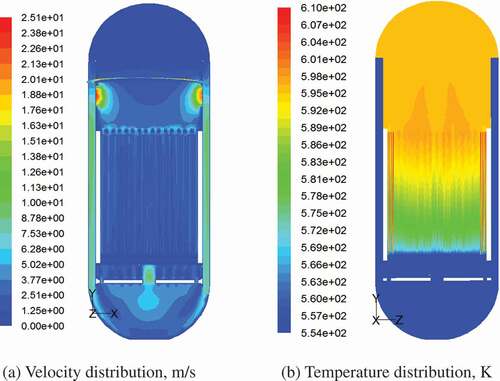
Figure 5. Velocity distribution of reactor core, m/s. (a) Lower grid plate inlet section (b) upper grid plate outlet section.
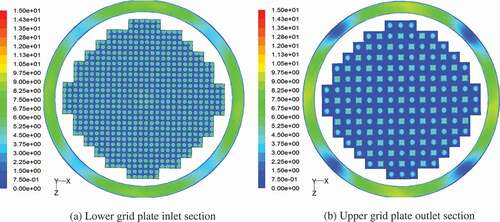
Figure 6. Flow distribution of loop fault. (a) Velocity distribution, m/s (b) temperature distribution, K.
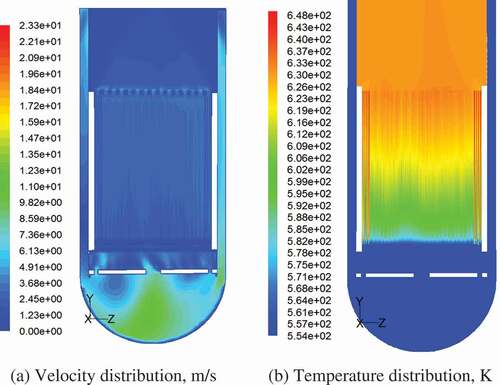
Figure 7. Velocity distribution at the lower grid plate inlet section of loop fault, m/s.
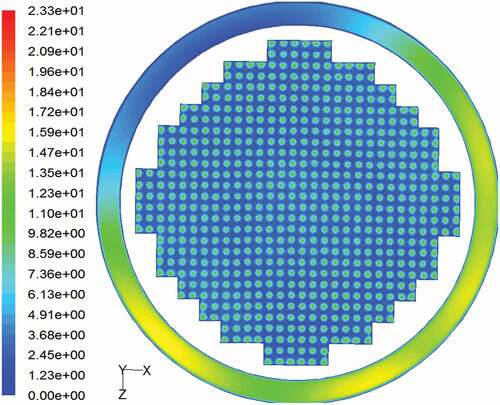
Figure 8. Flow distribution of annular channel blocking accident (a) Velocity distribution, m/s (b) temperature distribution, K.
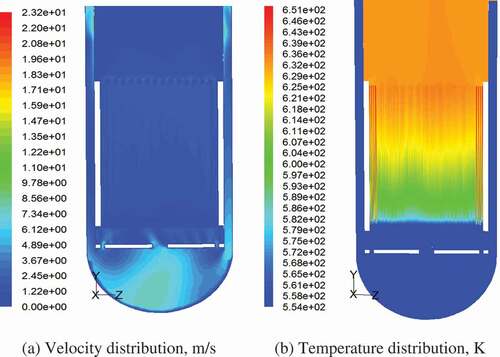
Figure 9. Comparison of CHF and DNBR between AP1000 reactor and CPR1000 reactor. (a) AP1000 reactor (b) CPR1000 reactor.
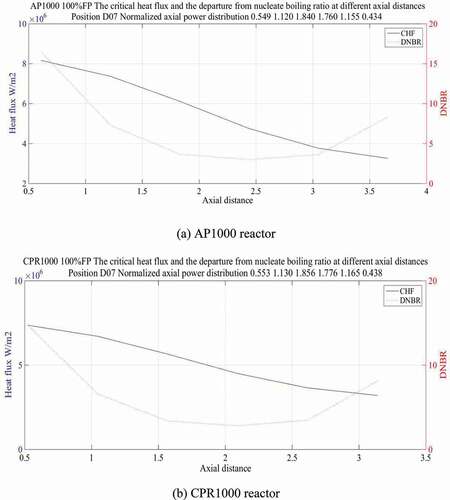
Table 3. Main design parameters of AP1000 and CPR1000 reactor
Figure 10. Comparison of AP1000 and CPR1000 rod bundles channel test. (a) Temperature rise trends of AP1000 (b) temperature rise trends of CPR1000.
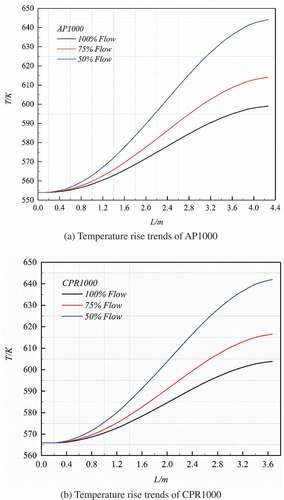
Figure 11. Distribution of the (a) neutron fluence rate and (b) reactor core temperature on CPR1000.
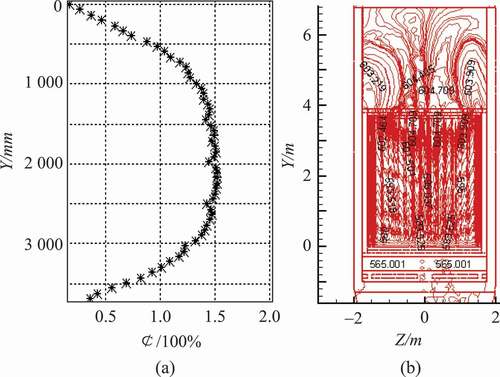
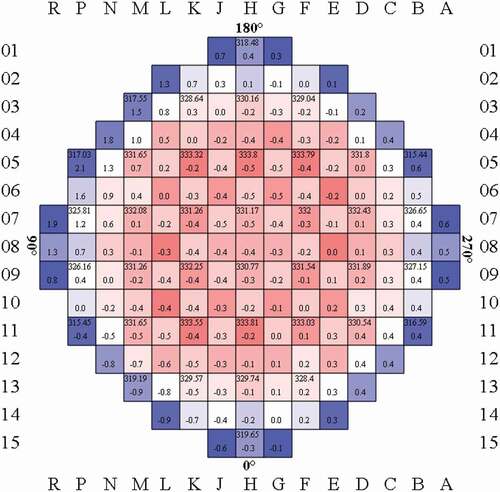
Figure 12. Reactor core outlet temperature field distribution.