Figures & data
Figure 1. Nuclide production cross-sections for the Ni(
)
Be,
Ni(
)
Na,
Ni(
)
Cr, and
Ni(
)
Co reactions. The dashed blue line and the light blue band present the mean of the generated predictive distribution and
2
about the mean, respectively, generated from the experimental dataset without experimental data from Takeshita et al. The green line and the light green band present the mean of the generated predictive distribution and
2
about the mean, respectively, generated from the experimental dataset including the experimental data from Takeshita et al.
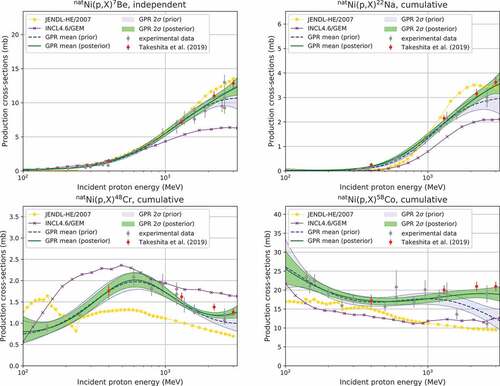
Table 1. Optimal hyperparameters.
Figure 2. Relative uncertainties (1) in the generated cross-sections
for the
Ni(
)
Be,
Ni(
)
Na,
Ni(
)
Cr, and
Ni(
)
Co reactions. The solid and dashed blue lines present the upper and lower bounds of 1
, respectively, generated from the experimental dataset without the experimental data of Takeshita et al. The solid and dashed blue lines present the upper and lower bounds of 1
, respectively, generated from the experimental dataset with the experimental data from Takeshita et al.
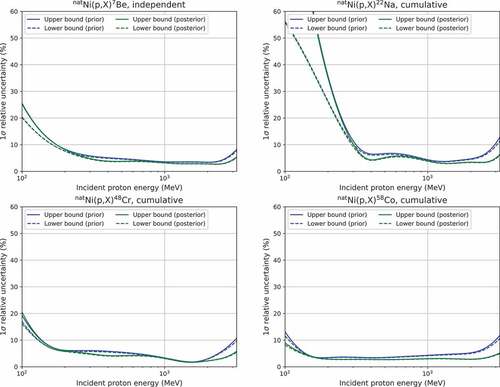
Figure 3. Correlation matrices among the target variables for the
Ni(
)
Be,
Ni(
)
Na,
Ni(
)
Cr, and
Ni(
)
Co reactions.
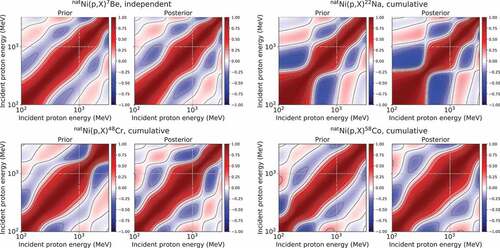
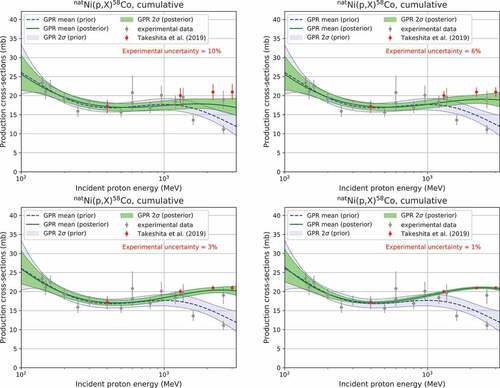
Figure 4. Comparison of GPR results for the Ni(
)
Co reaction under different experimental uncertainties.