
Figures & data
Figure 1. Schematic view of the charge distribution at even isobar.
is the most provable charge estimated from the unchanged charge distribution (UCD) assumption,
is the most probable charge derived from experimental data, and
, known as charge polarization, is difference of them
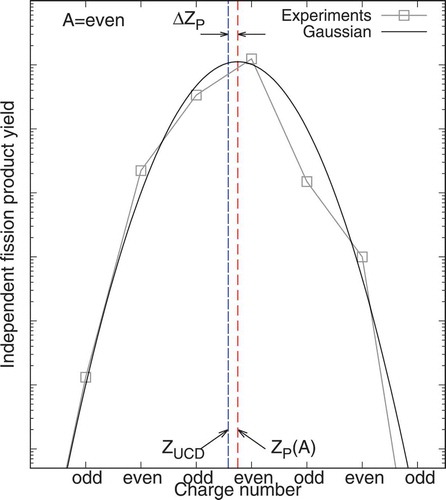
Table 1. List of the fissioning systems prepared by the new evaluation method described in this paper. Thermal and Fast denote FPY for thermal- and fast- neutron induced fission whereas Spontaneous denotes spontaneous fission. The sign ”✓” in the covariance column denotes that covariance data were evaluated for the corresponding fissioning system
Figure 2. The correlation matrix of from A = 102 to A = 103 for thermal-neutron induced fission in
U. Both axes correspond to the mass number
, the charge number
, and the index for meta-stable state
or
of the fission products. Positive and negative correlations are mapped by red and blue, respectively
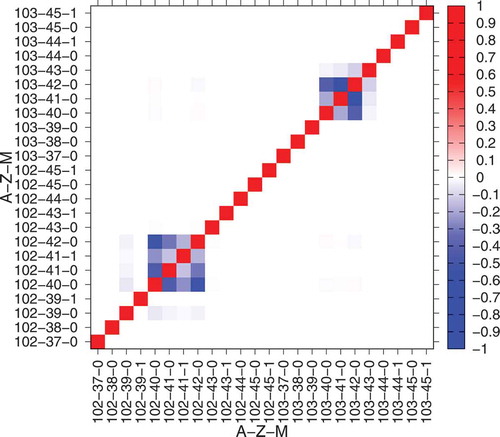
Figure 3. Correlation matrices of for thermal- (upper panels) and fast- (lower panels) neutron induced fission of selected nuclides
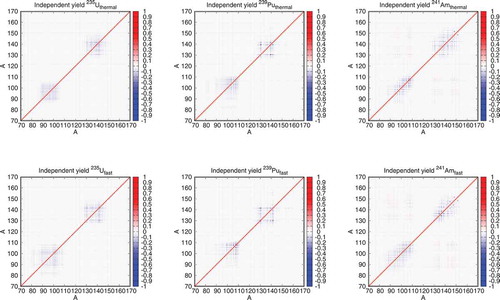
Figure 4. Comparison of the errors in the independent and cumulative yields of U(n
). The thin-broken line shows the diagonal element of the error given in JENDL/FPY-2011 for the independent yield. The thick broken line shows the cumulative yield obtained in the present work, while the thinner band surrounding it shows the error of corresponding cumulative yield. The dark band shows error in the cumulative yield obtained by error propagation from the covariance of independent yield but by discarding off-diagonal elements. The horizontal dot-dashed line with a gray band shows the mass-chain yield and its uncertainty given by England and Rider [Citation3]
![Figure 4. Comparison of the errors in the independent and cumulative yields of 235U(n th,f). The thin-broken line shows the diagonal element of the error given in JENDL/FPY-2011 for the independent yield. The thick broken line shows the cumulative yield obtained in the present work, while the thinner band surrounding it shows the error of corresponding cumulative yield. The dark band shows error in the cumulative yield obtained by error propagation from the covariance of independent yield but by discarding off-diagonal elements. The horizontal dot-dashed line with a gray band shows the mass-chain yield and its uncertainty given by England and Rider [Citation3]](/cms/asset/bc49d72c-05db-4110-843e-a8b5ae8d5f48/tnst_a_1813643_f0004_oc.jpg)
Figure 5. Comparison of the ratio between the calculated errors C and those evaluated by England and Rider E, C/E, in the mass-chain yield, as the function of the mass of fission product for
(left panel) and
(right panel) reactions. The filled circles show results when the full covariance matrices are taken into account in the mass-chain calculation, while the open diamonds are obtained when only the diagonal components are used discarding off-diagonal correlation
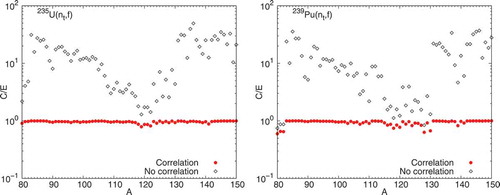
Figure 6. The mass distributions of independent FPY for thermal- (upper panels) and fast- (lower panels) neutron induced fission for U (left),
Pu (middle) and
Am (right). The presently evaluated data (filled circles) are compared with those of JENDL/FPY-2011 (open squares)
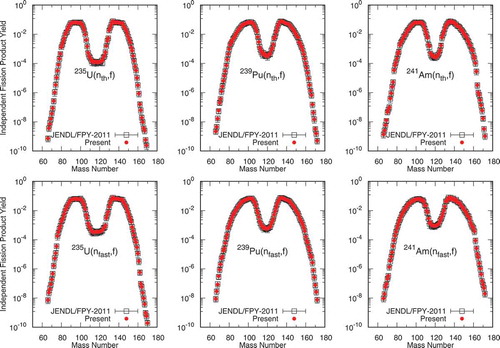
Figure 7. distributions of independent FPY in the same combination as.
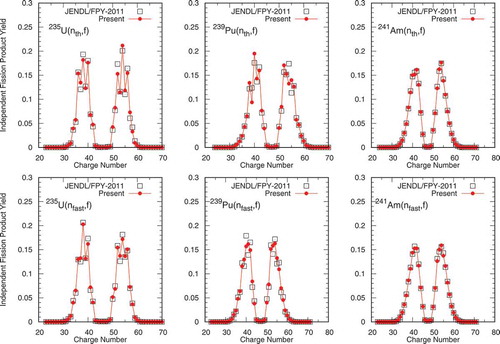
Figure 8. The isobaric charge distributions for at
,
,
, and
from
U(n
,f). The present evaluation (filled solid circles) is plotted together with the experimental data (diamonds), the experimental weighted average (filled squares), the evaluated data in JENDL/FPY-2011 (dash-dotted line), and JEFF-3.1.1 (thin broken line), and the pure Gaussian distributions without odd-even effects (broken line)
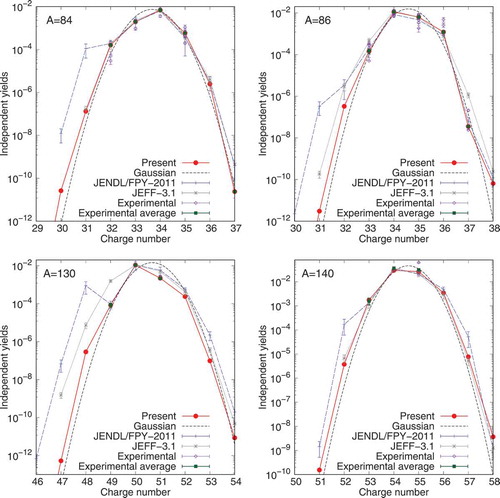
Figure 9. Comparison of the present for
U(n
,f) system; the top panel shows
in JENDL/FPY-2011 (open squares) and present study (filled circles). The bottom panel shows the ratio of these two (JENDL/Present)
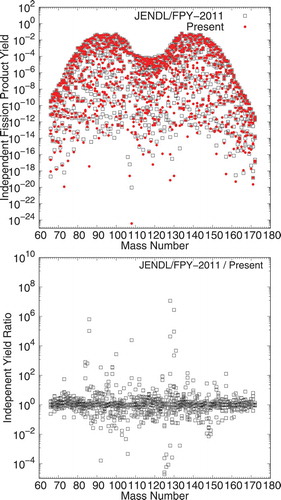
Figure 10. Comparison of the cumulative yields between the present evaluation (solid lines) and those taken from JENDL/FPY-2011 (broken lines) for selected nuclides from thermal-neutron induced fission of U. Only
for the ground state (
=0) are plotted
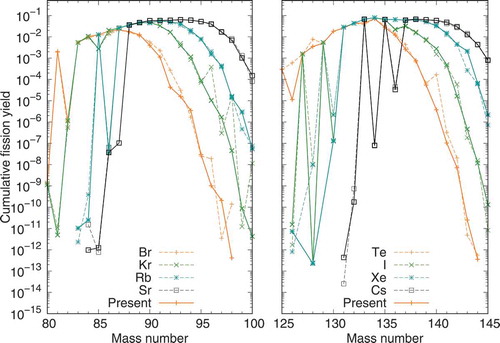
Figure 11. Comparison of the calculated and evaluated cumulative fission yields for
U at thermal energy; the top panel shows the
in JENDL/FPY-2011 (open squares) and present study (dots). The bottom panel shows the ratio of them
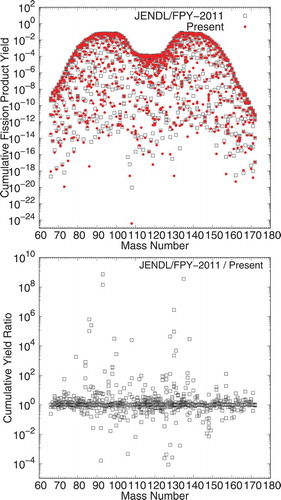
Figure 12. Calculated delayed neutron yield (DN) from burst U(n
,f) reaction as a function of cooling time. Solid and dotted lines correspond to the results with or without isomer ratio calculated by the Hauser-Feshbach calculations, respectively. Broken line exhibits results by JENDL/FPY-2011. Experimental DN analyzed by Keepin et.al [Citation29] are also plotted as open squares. An error of 5% was temporarily assigned to the Keepin’s results
![Figure 12. Calculated delayed neutron yield (DN) from burst 235U(n th,f) reaction as a function of cooling time. Solid and dotted lines correspond to the results with or without isomer ratio calculated by the Hauser-Feshbach calculations, respectively. Broken line exhibits results by JENDL/FPY-2011. Experimental DN analyzed by Keepin et.al [Citation29] are also plotted as open squares. An error of 5% was temporarily assigned to the Keepin’s results](/cms/asset/576f609e-8414-4609-9f9c-a4f881d66a54/tnst_a_1813643_f0012_oc.jpg)
Figure 13. Calculated -ray (lower) and
-ray (upper) components of the decay heat (DH) after a fission burst in
U compared with experimental data. The calculations are based on the present
(solid line), JENDL/FPY-2011 (dashed line), and experimental data from ORNL [Citation30], Lowell [Citation31] and Yayoi [Citation32]. Note that the vertical axis stands for the decay power (MeV/s) multiplied by the cooling time (s) for concise display on the linear s
![Figure 13. Calculated β-ray (lower) and γ-ray (upper) components of the decay heat (DH) after a fission burst in 235U compared with experimental data. The calculations are based on the present YI(Z,A) (solid line), JENDL/FPY-2011 (dashed line), and experimental data from ORNL [Citation30], Lowell [Citation31] and Yayoi [Citation32]. Note that the vertical axis stands for the decay power (MeV/s) multiplied by the cooling time (s) for concise display on the linear s](/cms/asset/d5fc59e7-dfef-4a9f-9cea-6bb459dca4e3/tnst_a_1813643_f0013_oc.jpg)
Figure 14. Calculated antineutrino energy spectra from four fissioning systems under neutron irradiation
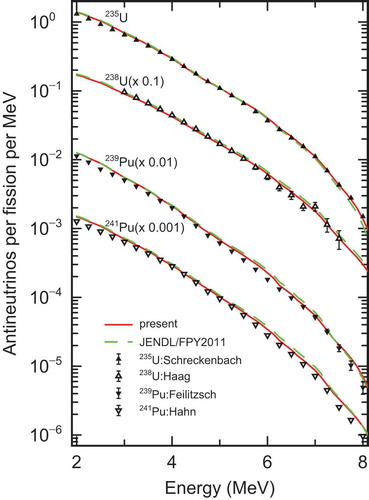
Figure 15. Ratio of calculation to experimental (C/E) of post-irradiation examinations (PIE) of UO fuel irradiated at Mihama-3 [Citation39] and Takahama-3 [Citation40,Citation41]. The squares show the burn-up calculation results obtained by using JENDL/FPY-2011, and filled circles show the results using the present FPY data. The error bar shows the experimental error
![Figure 15. Ratio of calculation to experimental (C/E) of post-irradiation examinations (PIE) of UO 2 fuel irradiated at Mihama-3 [Citation39] and Takahama-3 [Citation40,Citation41]. The squares show the burn-up calculation results obtained by using JENDL/FPY-2011, and filled circles show the results using the present FPY data. The error bar shows the experimental error](/cms/asset/6b704664-e0c9-494a-b9ad-b888f96e11a1/tnst_a_1813643_f0015_oc.jpg)