
Figures & data
Table 1. Input parameters used in the DWBA calculation
Table 2. Discrete states considered in the DWBA calculation for the reactions
Table 3. Discrete states considered in the DWBA calculation for the reactions
Table 4. Discrete states considered in the DWBA calculation for the reactions
Figure 1. Neutron yields from a thick Li target calculated by MCNP-6.2 with the ACE file and by PHITS-3.20 with the Frag-Data file. The incident deuteron energy is 25 MeV, and the emission angle is 15
. Statistical errors are less than 20
in all energy bins
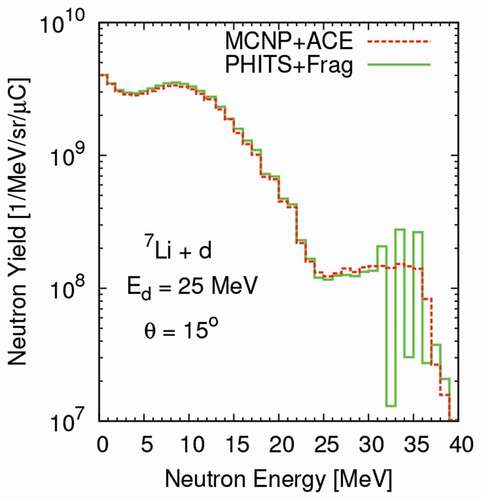
Figure 2. Calculated and experimental DDXs for the Li reactions at 40 MeV. The dotted, dash-dot-dotted, and dashed curves represent the component of elastic breakup (EB), nonelastic breakup (NEB), and pre-equilibrium and compound nucleus processes (PE+CN), respectively. The solid curves are sums of each component. The squares are the experimental data taken from Ref [Citation48]. The number at the top of each plot denotes the emission angle. The target in the calculation is
Li but that in the experiment is natural lithium (92.5%
Li and 7.5%
Li)
![Figure 2. Calculated and experimental DDXs for the Li(d,xn) reactions at 40 MeV. The dotted, dash-dot-dotted, and dashed curves represent the component of elastic breakup (EB), nonelastic breakup (NEB), and pre-equilibrium and compound nucleus processes (PE+CN), respectively. The solid curves are sums of each component. The squares are the experimental data taken from Ref [Citation48]. The number at the top of each plot denotes the emission angle. The target in the calculation is 7Li but that in the experiment is natural lithium (92.5% 7Li and 7.5% 6Li)](/cms/asset/1f5b7756-0048-4182-92a5-9a0399c457a3/tnst_a_1870010_f0002_oc.jpg)
Figure 3. Same as , but the ranges of the vertical and horizontal axes are changed. The dashed and dotted curves represent the component of pre-equilibrium and compound nucleus processes with and without particle decay from discrete levels (PD-DL), respectively
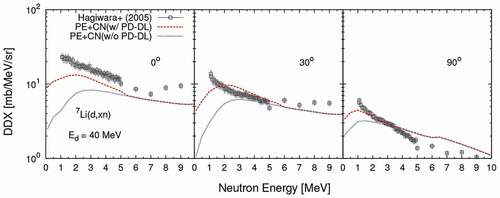
Figure 4. Calculated and experimental DDXs for the reactions on natural lithium at 40 MeV. The solid and dashed lines represent the calculated results with MCNP-6.2 using the ACE file of JENDL/DEU-2020 and with the models implemented in PHITS-3.20. The dash-dot-dotted lines are the values of TENDL-2017. The squares are the experimental data taken from Ref [Citation48]. The number at the top of each plot denotes the emission angle
![Figure 4. Calculated and experimental DDXs for the (d,xn) reactions on natural lithium at 40 MeV. The solid and dashed lines represent the calculated results with MCNP-6.2 using the ACE file of JENDL/DEU-2020 and with the models implemented in PHITS-3.20. The dash-dot-dotted lines are the values of TENDL-2017. The squares are the experimental data taken from Ref [Citation48]. The number at the top of each plot denotes the emission angle](/cms/asset/d86d9550-eefc-493f-8a94-d9bae7dd825d/tnst_a_1870010_f0004_oc.jpg)
Figure 5. Same as but for 16.4 MeV. The dash-dotted and dotted lines are the evaluated values on Li of ENDF/B-VIII.0 and ENDF/B-VII.1. The experimental data were taken from Ref [Citation56]
![Figure 5. Same as Figure 4 but for 16.4 MeV. The dash-dotted and dotted lines are the evaluated values on 7Li of ENDF/B-VIII.0 and ENDF/B-VII.1. The experimental data were taken from Ref [Citation56]](/cms/asset/14cfc65b-5d54-4b76-bb7e-ad30af642886/tnst_a_1870010_f0005_oc.jpg)
Figure 6. Same as but for 25 MeV. The experimental data were taken from Ref [Citation57]
![Figure 6. Same as Figure 4 but for 25 MeV. The experimental data were taken from Ref [Citation57]](/cms/asset/90b0e8c3-abfe-47a4-bf99-459eb647799b/tnst_a_1870010_f0006_oc.jpg)
Figure 7. Same as but for 102 MeV. The experimental data were taken from Ref [Citation58]
![Figure 7. Same as Figure 4 but for 102 MeV. The experimental data were taken from Ref [Citation58]](/cms/asset/2ed9696d-4c5d-41fc-986b-677e81772a10/tnst_a_1870010_f0007_oc.jpg)
Figure 8. Same as but for 200 MeV. The experimental data were taken from Ref [Citation51]
![Figure 8. Same as Figure 4 but for 200 MeV. The experimental data were taken from Ref [Citation51]](/cms/asset/ec6eb468-4cda-4375-ab63-e9dc15a0f1f3/tnst_a_1870010_f0008_oc.jpg)
Table 5. Input parameters used in the TTNY calculation. The target thickness is set to be the same as that used in the TTNY experiment presented in the rightmost column
Figure 9. Experimental and calculated neutron yields from a thick natural lithium target bombarded by a 9-MeV deuteron. The solid and dashed lines represent the calculated results with MCNP-6.2 using the ACE file of JENDL/DEU-2020 and with the models implemented in PHITS-3.20, respectively. The squares are the experimental data taken from Ref [Citation59]. The number at the top of each plot denotes the emission angle
![Figure 9. Experimental and calculated neutron yields from a thick natural lithium target bombarded by a 9-MeV deuteron. The solid and dashed lines represent the calculated results with MCNP-6.2 using the ACE file of JENDL/DEU-2020 and with the models implemented in PHITS-3.20, respectively. The squares are the experimental data taken from Ref [Citation59]. The number at the top of each plot denotes the emission angle](/cms/asset/4a60e016-5f33-4808-9007-1e08eb58de22/tnst_a_1870010_f0009_oc.jpg)
Figure 10. Same as but for a 25-MeV deuteron on natural lithium. The experimental data were taken from Ref [Citation60]
![Figure 10. Same as Figure 9 but for a 25-MeV deuteron on natural lithium. The experimental data were taken from Ref [Citation60]](/cms/asset/45c6424a-c12f-4ab8-add7-74c51e10d07c/tnst_a_1870010_f0010_oc.jpg)
Figure 11. Same as but for a 40-MeV deuteron on natural lithium. The experimental data were taken from Ref [Citation48]
![Figure 11. Same as Figure 9 but for a 40-MeV deuteron on natural lithium. The experimental data were taken from Ref [Citation48]](/cms/asset/40981459-1d24-4cc2-bab5-9a165e3886f8/tnst_a_1870010_f0011_oc.jpg)
Figure 12. Same as but for a thick beryllium target bombarded by a 25-MeV deuteron. The experimental data were taken from Ref [Citation60]
![Figure 12. Same as Figure 9 but for a thick beryllium target bombarded by a 25-MeV deuteron. The experimental data were taken from Ref [Citation60]](/cms/asset/33c78d02-99c4-48dd-9e3a-8bd5e4435725/tnst_a_1870010_f0012_oc.jpg)
Figure 13. Same as but for a 50-MeV deuteron on beryllium. The experimental data were taken from Ref [Citation61]
![Figure 13. Same as Figure 12 but for a 50-MeV deuteron on beryllium. The experimental data were taken from Ref [Citation61]](/cms/asset/986090d6-40e1-4baf-ac80-3616c88bb1af/tnst_a_1870010_f0013_oc.jpg)
Figure 14. Same as but for a thick natural carbon target bombarded by a 18-MeV deuteron. The experimental data were taken from Ref [Citation59]
![Figure 14. Same as Figure 9 but for a thick natural carbon target bombarded by a 18-MeV deuteron. The experimental data were taken from Ref [Citation59]](/cms/asset/4f540d62-5ee9-4d8d-850d-2422afadd8f7/tnst_a_1870010_f0014_oc.jpg)
Figure 15. Same as but for a 40-MeV deuteron on natural carbon. The experimental data were taken from Ref [Citation62]
![Figure 15. Same as Figure 14 but for a 40-MeV deuteron on natural carbon. The experimental data were taken from Ref [Citation62]](/cms/asset/0ea7d687-5d05-44c9-aa4c-9e105db67acc/tnst_a_1870010_f0015_oc.jpg)