
Figures & data
Figure 1. Flowchart of tsunami PRA procedure.
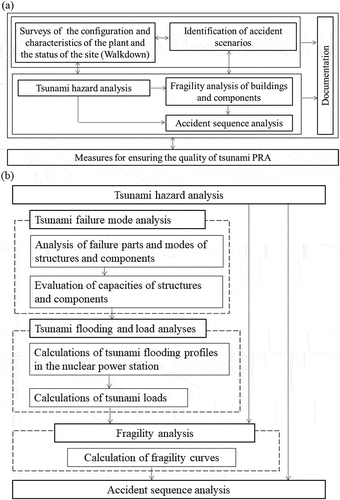
Figure 2. Flowchart of tsunami PRA adopting a risk-based graded approach.
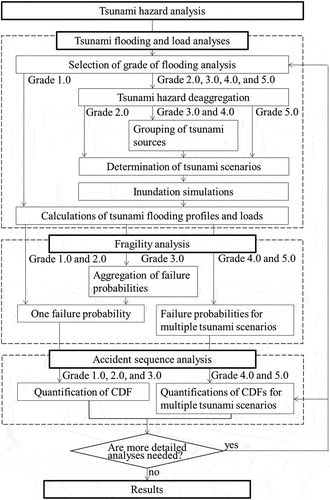
Table 1. Key differences among five grades.
Figure 3. Location of virtual nuclear power station analyzed in this study. Site was hypothetically determined at non-existent location.
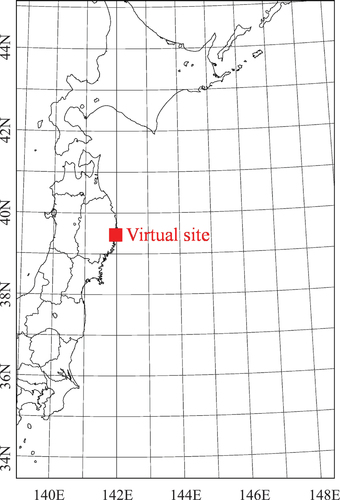
Figure 4. Layout of virtual nuclear power station. Elevations around virtual nuclear power station. Interval of contour lines of (a) is 10 m. Area of (b) is depicted with dashed lines in (a). R/B, T/B, Hx/B, LOT, and CST denote reactor building, turbine building, heat exchanger building, light oil tank, and condensate storage tank. The color contour in (b) denotes the elevations at the ground and buildings.
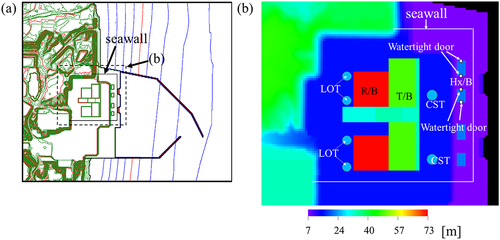
Figure 5. Earthquake source zones used for tsunami hazard analysis.
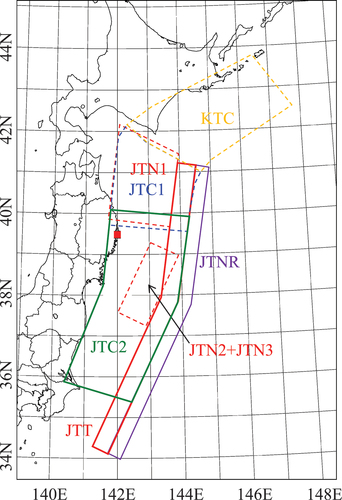
Figure 6. Spatial distributions of slips of 25 tsunami sources for JTC2. The color contour denotes slip and the unit is in meters. Groups which will be used in Grades 3.0 and 4.0 are also shown.
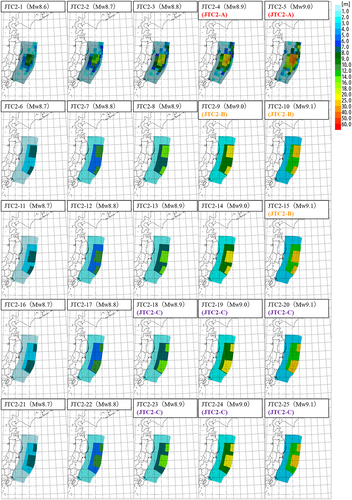
Figure 7. (A) Mean, 5% fractile, median, and 95% fractile hazard curves. (b) Mean hazard curve for each earthquake source zone.
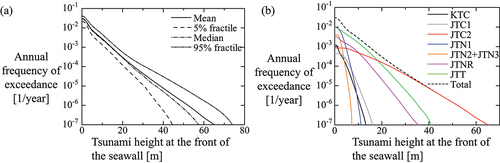
Table 2. List of tsunami sources with high hazard contributions for 31, 35, 39, 43, and 47 m. Hazard contributions C are also described.
Figure 8. Failure probability of watertight doors of heat exchanger buildings at each tsunami height is shown with reliabilities at intervals of 10% from 5 to 95% with 10 solid circles for Grade 1.0. Line shows mean fragility curve.
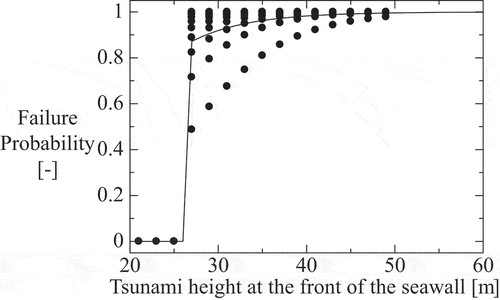
Figure 9. Spatial distributions of Inundation depth in the site calculated by the inundation simulation for the tsunami scenario of JTC2–25 at 39 m. Snapshots between 1570 s (a) and 1800 s (f) are shown. The color contour denotes the inundation depth. The white area is the non-inundated area. The number written in (a) denotes the elevation of the ground level.
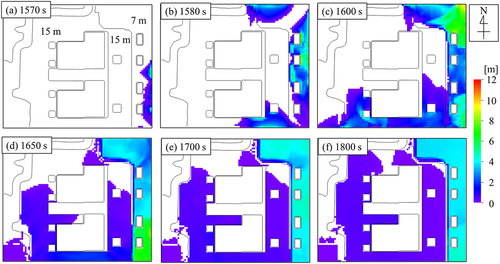
Figure 10. Failure probability of watertight doors of heat exchanger buildings at each tsunami height is shown with reliabilities at intervals of 10% from 5 to 95% with 10 solid circles for Grade 2.0. Solid line denotes approximated mean fragility curve. Dashed, chain dashed, and chain double-dashed lines denote the approximated fractile fragility curves for 5, 50, and 95% reliabilities. Response is evaluated by flood profiles of tsunami scenarios corresponding to JTC2–25.
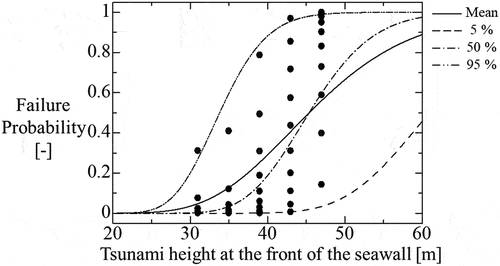
Figure 11. Relationships between latitude of the tsunami energy center and ratio of the tsunami heights at seawall to those at offshore site for tsunami heights of 35 and 43 m. Color contours and sizes of circles denote hazard contributions.
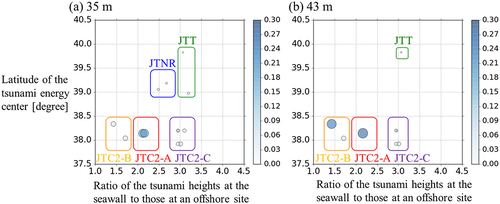
Table 3. List of groups and tsunami sources belonging to each group.
Figure 12. Time series of the inundation depths at the watertight door of the heat exchanger building (the yellow circle in (f)) for 39 m.
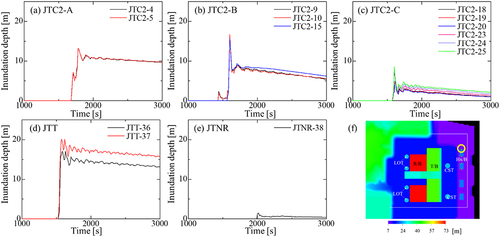
Figure 13. Failure probability of watertight doors of heat exchanger buildings at each tsunami height is shown with reliabilities at intervals of 10% from 5 to 95% with 10 solid circles for Grade 3.0. Solid line denotes approximated mean fragility curve. Dashed, chain dashed, and chain double-dashed lines denote the approximated fractile fragility curves for 5, 50, and 95% reliabilities.
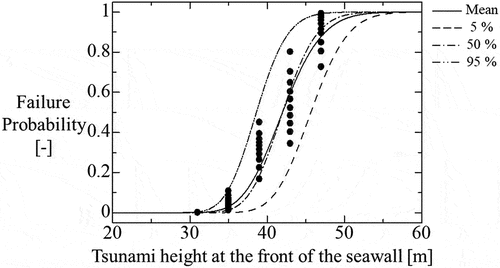
Figure 14. Conceptual diagram for the explanation on the difference in failure probability due to the difference of the abscissa. (a) Failure density function as a function of inundation depth. (b) Black solid line is the same failure density function as a function of tsunami height. Red solid line is the approximation of the black line in (b).
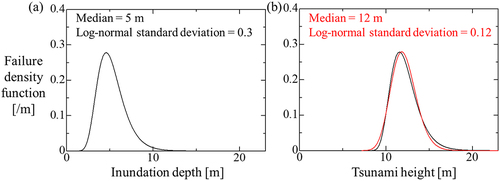
Figure 15. Failure probability of watertight doors of heat exchanger buildings at each tsunami height for each tsunami scenario is shown with reliabilities at intervals of 10% from 5 to 95% with 10 solid circles for Grade 4.0. Solid line denotes approximated mean fragility curve. Dashed, chain dashed, and chain double-dashed lines denote the approximated fractile fragility curves for 5, 50, and 95% reliabilities.
Table 4. Median, , and
of fragility curves for failure of doors of heat exchanger buildings for Grade 4.0. Tsunami sources which tsunami scenarios correspond to are described in the first column.
Figure 16. Failure probability of watertight doors of heat exchanger buildings at each tsunami height for each tsunami scenario is shown with reliabilities at intervals of 10% from 5 to 95% with 10 solid circles for Grade 5.0. Solid line denotes approximated mean fragility curve. Dashed, chain dashed, and chain double-dashed lines denote the approximated fractile fragility curves for 5, 50, and 95% reliabilities.
Table 5. Median, , and
of fragility curves for failure of doors of heat exchanger buildings for Grade 5.0. Tsunami sources which tsunami scenarios correspond to are described in the first column.
Figure 17. Annual frequencies of failure of watertight doors of heat exchanger buildings evaluated by Grades 1.0–5.0. Mean values are denoted by solid circles, and width of reliability between 10 and 90% are denoted by error bars. Those of tsunami hazards are also shown.
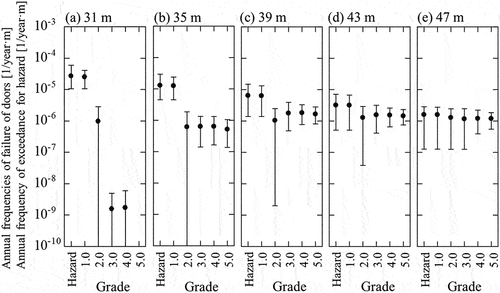
Table A1. Inundation depth in front of watertight door of heat exchanger building calculated using inundation simulation for each tsunami scenario at tsunami heights of 31, 35, 39, 43, and 47 m. The tsunami sources which tsunami scenarios corresponds to are described. The tsunami sources with non-zero hazard contributions are listed, and [-] are described if there are not such tsunami sources corresponding to the ranks.