Figures & data
Table 1. Descriptive statistics.
Table 2. Correlations between study variables, separately for girls (below the diagonal; N = 632) and boys (above the diagonal; N = 543).
Figure 1. Predicted values for school-standardized friendship nominations.
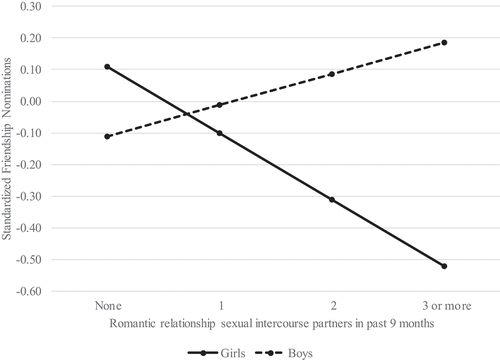
Table 3. OLS regression models of received friendship nominations, peer dislike nominations, and perceived popularity (n = 1,175).
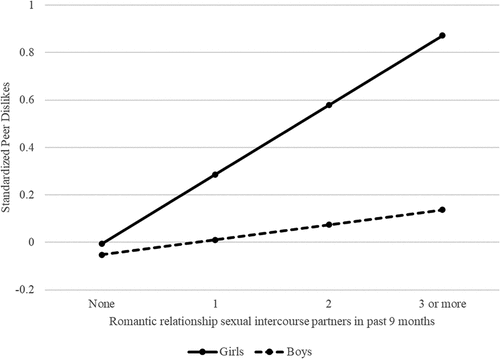
Figure 2. Predicted values for school-standardized peer dislike nominations.