Figures & data
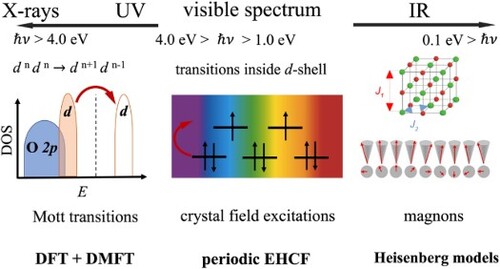
Figure 1. Classification of the experimentally observed low-lying transitions in TM oxides.
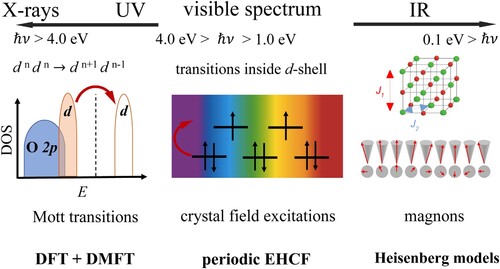
Figure 2. Schematic representations of the proposed methodology and data exchange between EHCF and GoGreenGo modules.
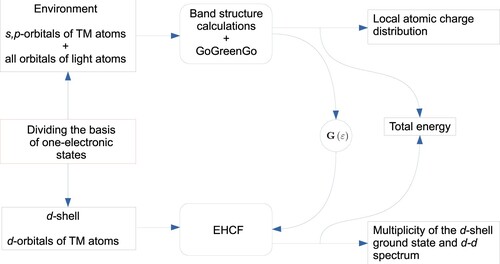
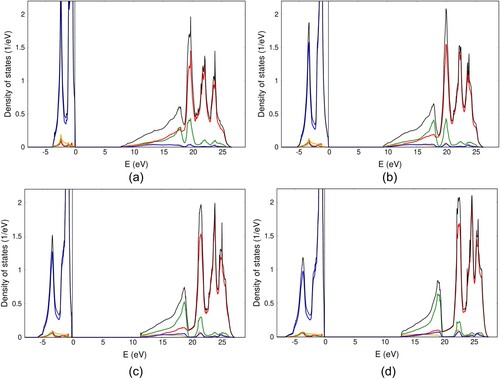
Figure 3. Periodic EHCF calculations of (a) total (black) and orbital projected density of states for NiO: orange – O 2s, blue – O 2p, green – Ni 4s and red – Ni 4p; (b) resonance term defined in Equation (Equation18
(18)
(18) ) for both
(blue) and
(red) d-orbitals.
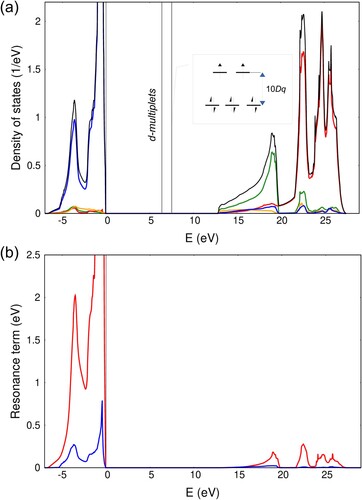
Table 1. Periodic EHCF parameters of the electronic band structure of l-system: is the energy gap between valence and conduction s,p-bands, and
are effective atomic charges on metal and oxygen.
Table 2. Periodic EHCF splitting parameter of d-orbitals compared to the experimental data and cluster model calculations [Citation25]; MAE and MPAE for optical spectra lines are calculated based on Tables .
Table 3. Periodic EHCF d-d transitions in MnO compared to the experimental data [Citation74] and cluster model calculations [Citation25].
Table 4. Periodic EHCF d-d transitions in FeO compared to the experimental data [Citation76,Citation77] and cluster model calculations [Citation25].
Table 5. Periodic EHCF d-d transitions in CoO compared to the experimental data [Citation74] and cluster model calculations [Citation25].
Table 6. Periodic EHCF d-d transitions in NiO compared to the experimental data [Citation2], cluster model calculations [Citation25], and recent DMFT calculations of the triplet-triplet transitions [Citation78].
Figure 4. Periodic EHCF calculations of (a) total (black) and orbital projected density of states for MgO: orange – O 2s, blue – O 2p, green – Mg 3s and red – Mg 3p; (b) perturbed (red) and unperturbed (blue) density of states on the impurity site in Ni:MgO; (c) same as (b) but for the oxygen sites surrounding the TM point defect.
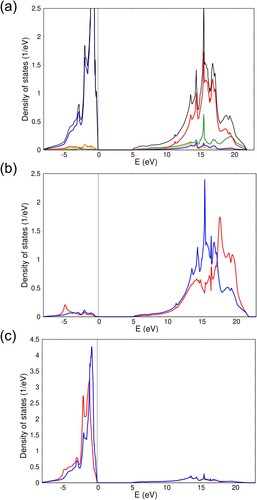
Table 7. Periodic EHCF atomic charges induced by the point defect in Co:MgO and Ni:MgO compared to the corresponding values in the ideal MgO crystal.
Table 8. Splitting parameter of d-orbitals for Co:MgO and Ni:MgO compared to the experimental data.
Table 9. Periodic EHCF d-d transitions in Co:MgO compared to the experimental data [Citation80].
Table 10. Periodic EHCF d-d transitions in Ni:MgO compared to experimental data [Citation81].
Figure A1. Total and orbital projected densities of states for MnO (a), FeO (b), CoO (c) and NiO (d). Low lying wide 2s bands located in the interval from are not shown for clarity. Color code is the same as in Figure (a).