
Figures & data
Figure D1. Bivariate superiority and inferiority spaces for the All, Any, and Compensatory () rules.
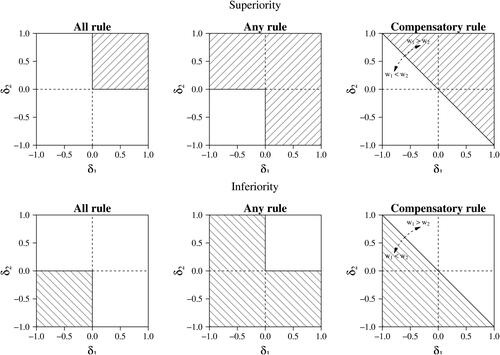
Figure D2. Traceplot of MCMC chains for the application of Bayesian multivariate logistic regression to the IST data.
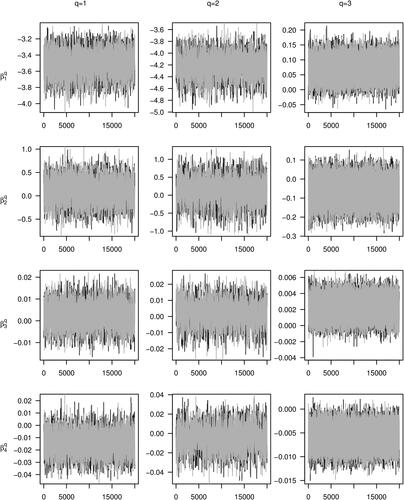
Figure D3. Comparison of CATEs and their standard deviations per interval of blood pressure after stratified multivariate analysis (mB) and multivariate logistic regression (mLR). Each interval reflects one standard deviation.
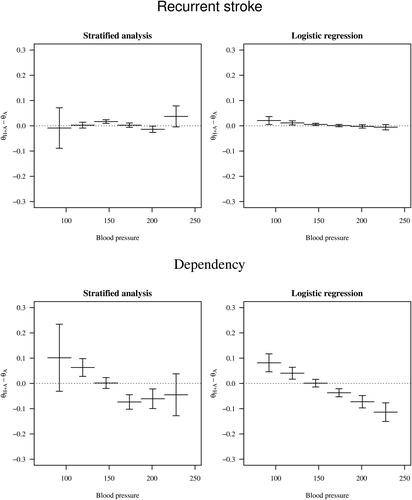
Table D1. Example of required sample sizes (n) for analysis with correlated data and anticipated probabilities to conclude superiority when sample size computations use the true correlation () vs. assume uncorrelated dependent variables (
) under four different data-generating mechanisms (DGMs).
Table D2. Parameters of average treatment effects (ATEs) in the trial and conditional average treatment effects (CATEs) in a subpopulation for two outcome variables.
Table D3. Required sample sizes to evaluate the average treatment effect (ATE) and conditional treatment effect (CATE) for two outcome variables.
Table D4. Bias in average treatment differences of effect size (ES) 4.1 and 4.2 by decision rule.
Table D5. Proportions of superiority decisions for ATEs with two outcome variables by data-generating mechanism, correlation, and decision rule.
Table D6. Proportions of superiority decisions for CATEs with two outcome variables by data-generating mechanism, correlation, and decision rule.
Table D7. Average and conditional average treatment effects (ATE and CATE respectively) and their posterior probabilities (pp) in the IST data, by interval of blood pressure (Bp). Superiority or inferiority was concluded when or
respectively.
Table D8. Conditional average treatment effects in the IST data, by value of blood pressure (Bp). Superiority or inferiority was concluded when or
respectively.
Table D9. Example of means of the prior distribution of regression coefficients.
Table D10. Parameters of average treatment effects (ATEs) in the trial and conditional average treatment effects (CATEs) in a subpopulation for tree outcome variables.
Table D11. Required sample sizes to evaluate the average treatment effect (ATE) and conditional treatment effect (CATE) for three outcome variables.
Table D12. Proportions of superiority decisions for three outcome variables by data-generating mechanism, correlation, and decision rule.