
Figures & data
Figure 1. Enzymatic activities of Neofusicoccum parvum Bt-67 secretomes when grown on minimal media with grapevine canes (GP), wheat straw (WS), or glucose (GLU) at 7 and 14 days after inoculation. (A) Xylanase, (B) β-d-xylosidase, (C) α-l-arabinofuranosidase, and (D) β-d-glucosidase activities (IU·mL−1). Blue, red, and gray lines represent secretome activities from the GP, WS, and GLU conditions, respectively. All the measurements were performed in biological triplicates. Error bars indicate standard deviation. Different letters indicate significant differences among groups at each time point (Tukey’s HSD test; P < 0.05).
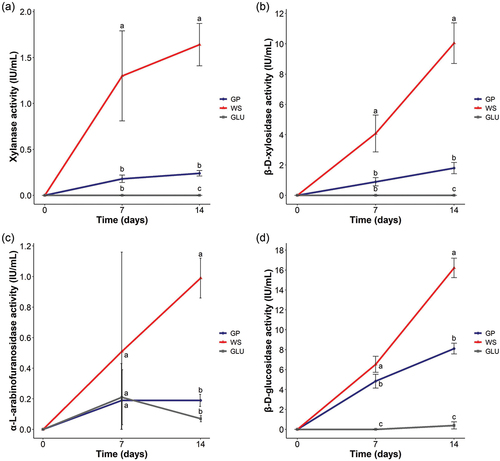
Figure 2. Degradation ratios of chemical bonds representative of grapevine canes and wheat straw determined by attenuated total reflectance Fourier transform infrared (ATR-FTIR) spectroscopy at 14 days after inoculation. Ratios correspond to the value obtained from the lignocellulose biomass with fungal growth over lignocellulose biomass without fungal growth. Bond vibration: ν (stretching), δ (bending), s (symmetric), a (asymmetric). All the measurements were performed in biological triplicates. Error bars indicate standard deviation. Asterisk stands for chemical bonds significantly degraded or enriched after fungal growth (one-way ANOVA; P < 0.05; see also SUPPLEMENTARY FIGS. 1 and 2).
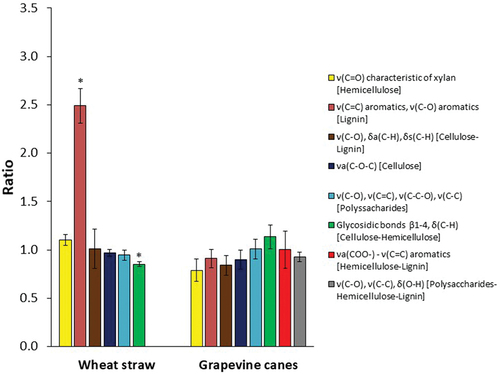
Table 1. Remarkable absorption bands in the attenuated total reflectance Fourier transform infrared (ATR-FTIR) spectra of wheat straw (WS) and grapevine canes (GP) (Adapa et al. Citation2009; Álvarez et al. Citation2020; Levasseur et al. Citation2013; Viel et al. Citation2018; Xu et al. Citation2013).
Figure 3. Heatmap and hierarchical clusters of significantly expressed genes of Neofusicoccum parvum Bt-67 grown with different carbon sources. GP = grapevine canes; WS = wheat straw; GLU = glucose. Numbers after carbon source treatments indicate biological repetitions. The scale from red to blue represents the log10(FPKM+1) value, where red indicates high expression levels and blue low expression levels. FPKM = fragments per kilobase of transcript sequence per millions mapped reads.
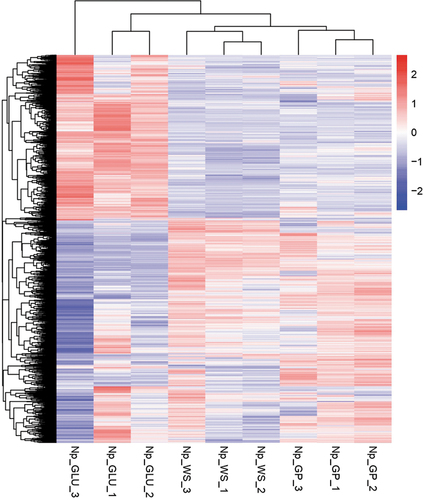
Figure 4. Gene ontology (GO) classifications for up-regulated (Up) and down-regulated (Down) genes and metabolic pathways in Neofusicoccum parvum Bt-67 when grown in presence of (A) grapevine canes (GP) or (B) wheat straw (WS). Comparisons were performed against gene expression of growth with glucose (GLU). Asterisk denotes statistical significance (P-adjust < 0.05). Significance was calculated using Wallenius noncentral hypergeometric distribution.
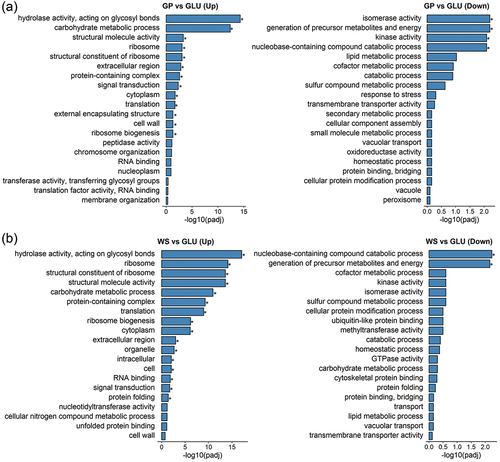
Figure 5. Venn diagrams of the differentially expressed genes (DEGs) in Neofusicoccum parvum Bt-67 grown in presence of different lignocellulosic biomasses. GP = grapevine canes; WS = wheat straw. Growth with glucose was used as control. The number in each circle indicates the number of DEGs for each condition. The overlapping number indicates the number of DEGs in both conditions.
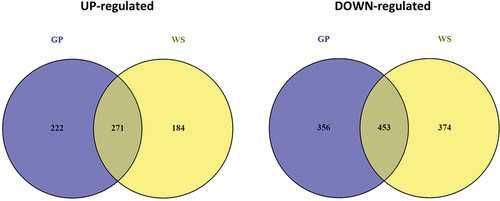
Figure 6. Venn diagram of up-regulated genes encoding carbohydrate-active enzymes (CAZymes) in Neofusicoccum parvum Bt-67 grown in presence of different lignocellulosic biomasses. GP = grapevine canes; WS = wheat straw. Growth with glucose was used as control. The number in each circle indicates the number of up-regulated CAZyme genes for each condition. The overlapping number indicates the number of up-regulated CAZyme genes in both conditions.
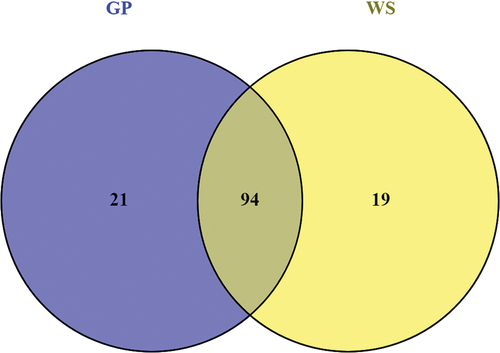
Table 2. Differentially expressed CAZymes (P < 0.05 and log2(fold change) > 2) of Neofusicoccum parvum Bt-67 during growth on minimal media containing grapevine canes (GP) or wheat straw (WS) relative to glucose (GLU).
Figure 7. Venn diagrams of metabolites produced by Neofusicoccum parvum Bt-67 grown in minimal media with grapevine canes (GP), wheat straw (WS), or glucose (GLU) as carbon sources. A. Total number of metabolites in the three conditions. B–D. The number of significantly different metabolites between each pair of conditions: GP vs. WS, GP vs. GLU, and GLU vs. WS. Significantly different metabolites were determined by one-way ANOVA (FDR < 0.05). Overlapping numbers indicate metabolites commonly produced in the compared conditions.
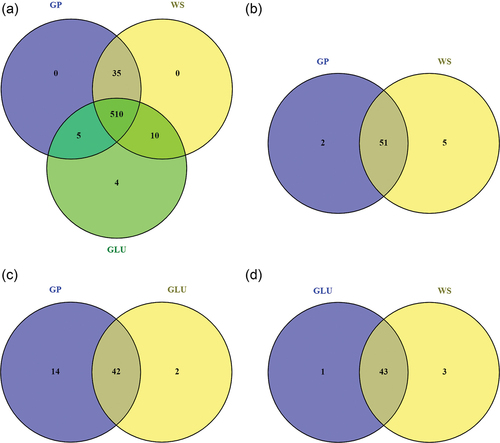
Figure 8. (A) Principal component analysis (PCA) and (B) partial least squares discriminant analysis (PLS-DA) based on the peak area of 564 metabolites produced by Neofusicoccum parvum Bt-67 grown in minimal media with different carbon sources: grapevine canes (blue), wheat straw (red), or glucose (gray). The percentage of variation of each component is indicated at each axis. Ellipses represent the 95% confidence interval. Q2 for the PLS-DA was 0.75.
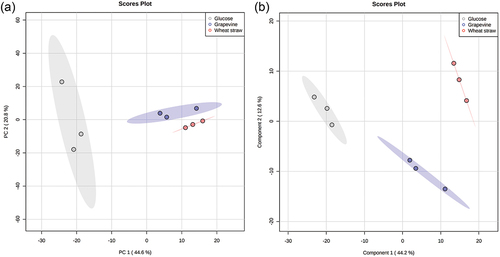
Table 3. The five most discriminant metabolites (FDR < 0.05) produced by Neofusicoccum parvum Bt-67 during growth on minimal media containing grapevine canes, wheat straw, or glucose.
Table 4. The top 10 differentially metabolites produced by Neofusicoccum parvum Bt-67 in comparison of each pair of carbon source conditions: grapevine canes (GP), wheat straw (WS), and glucose (GLU).